Monday 15th April, 2024
Tuesday 16th April, 2024
Wednesday 17th April, 2024
Thursday 18th April, 2024
Friday 19th April, 2024
Monday 15th April, 2024
Tuesday 16th April, 2024
Wednesday 17th April, 2024
Thursday 18th April, 2024
Friday 19th April, 2024
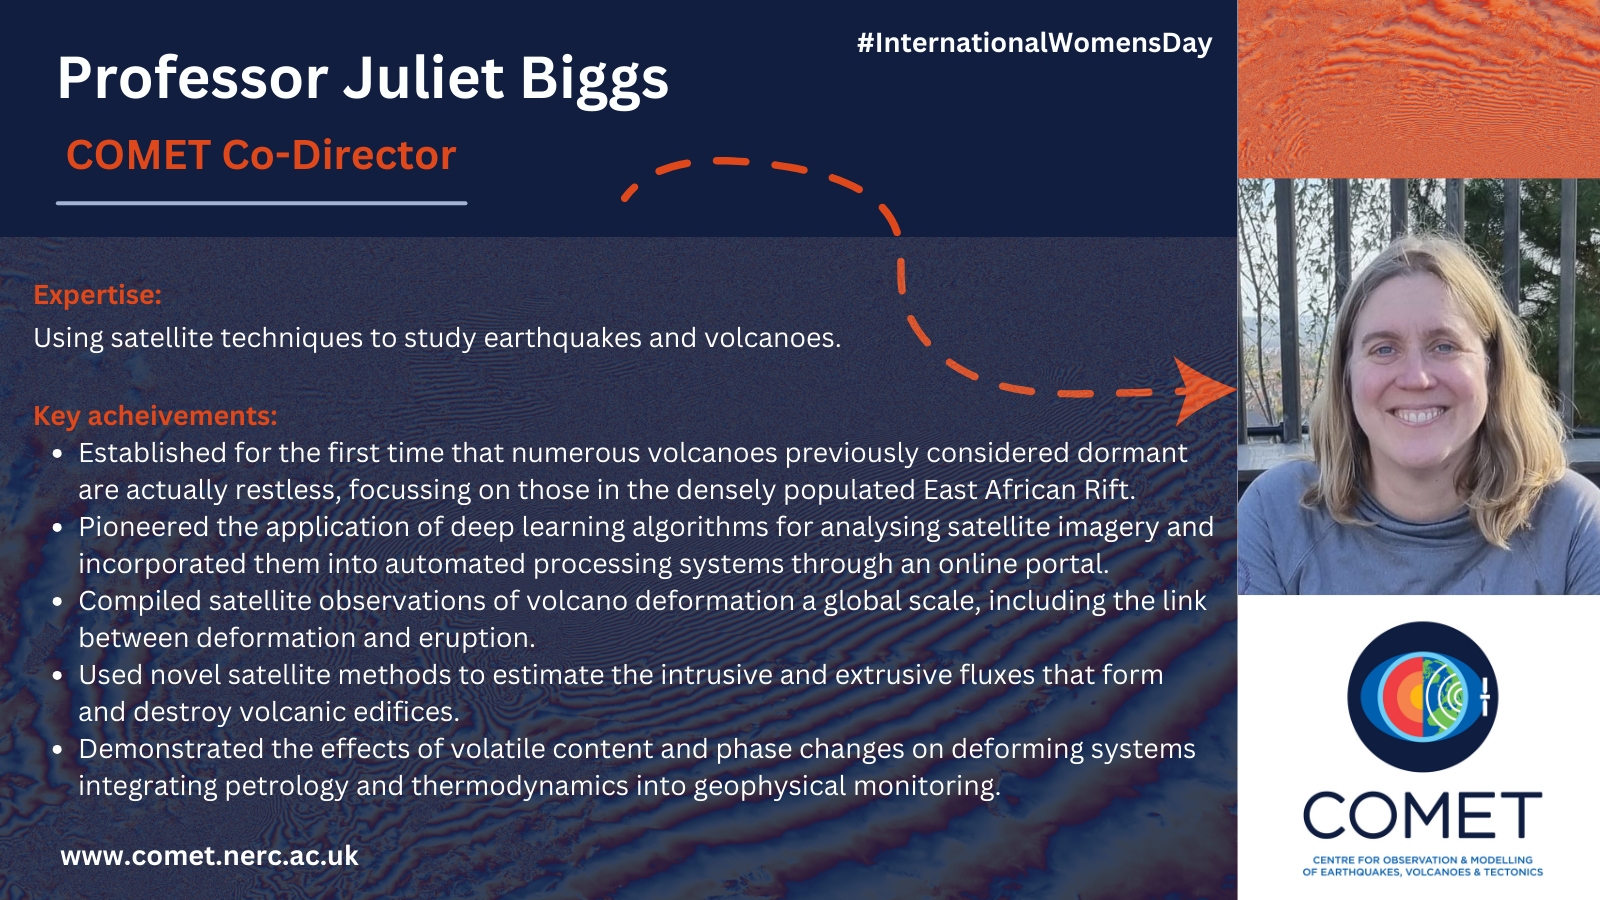
Today we celebrate all our amazing women at COMET and introduce you to some members of the COMET Directorate.
Meet COMET’s Co-Director Professor Juliet Biggs (Bristol), expert in using satellite techniques to study earthquakes and volcanoes.
Meet COMET’s Centre Manager, Charlie Royle (Leeds), expert in complex, cross-institutional programme delivery and strategic-planning.

Meet COMET’s Research and Events Officer Lucy Sharpson (Leeds), expert in the complexities of supporting multi-institute Centres and event planning.

A personal view from COMET* director, Prof Tim Wright
14 February 2023
We have all been shocked and horrified by the pictures coming from Türkiye and Syria over the past week following the two large earthquakes that happened on 6 February. COMET aims to generate and freely distribute robust scientific satellite deformation data sets following all moderate-large earthquakes on land. These can assist the humanitarian and scientific response.
Here I want to briefly explain COMET’s approach to responding to an event like this from my perspective not just as COMET director, but also as a scientist who has been involved in responding to many earthquakes using satellite deformation data and who has been working on active faulting in Türkiye for my entire career.
Deformation data from satellites are now a fundamental data set for understanding what happened in an earthquake, complementing the information that is available from seismology and from field studies. Deformation data shows, very precisely, which faults moved in an earthquake and by how much. Earthquakes are not point sources – they involve slip on faults. As earthquakes get larger, they involve larger/longer faults with increasing amounts of slip. Understanding how much and where slip occurred on a fault helps us understand the amount of shaking that is likely to have been experienced in different locations – distance to the fault is a primary control on the intensity of shaking.
In COMET, we have been developing a service to automatically produce ground movement data sets from radar satellites following all earthquakes bigger than Magnitude 5.5 that are likely to impact the land surface, and are now a trusted source for these data sets. This is possible because the Sentinel-1 satellites, part of the European Commission’s Copernicus programme, have a systematic acquisition strategy over tectonic and volcanic areas, something that COMET worked with the European Space Agency to help define. We produce results from satellite data as fast as possible following the satellite acquisition, make them available to the public via a dedicated portal, and typically let people know about them using the @NERC_COMET and @COMET_database accounts on twitter.
In the case of the Türkiye earthquakes, the data sets that we produced in COMET, which was also analysed by other international groups, show that the fault that ruptured in the initial Magnitude 7.8 earthquake was a 300 km long section of the East Anatolian Fault, and the fault that ruptured in the second large earthquake, a magnitude 7.5, was over 100 km long and occurred along a different branch of the same fault system. In UK terms, the length of the first fault is about the same as the distance from Bristol to Hull; and is close to the distance from London to Paris. This great extent is one of the reasons why the devastation has been so widespread and horrendous. Both earthquakes occurred on mapped faults and in areas where national maps of seismic hazard required the strictest building codes.
We believe it is important to analyse satellite data as quickly as possible and to be open and transparent with the results, sharing them with the wider community and allowing people to use them in whatever way they wish. For most earthquakes, we now have data within a few days of the event, and we post results within a few hours of the satellite data acquisition, whether there is any media interest in an event or not. We would like to be able to do this within a few hours of every event, and with new satellite systems from the Europe, the US/India, Japan, Canada, China, and others coming on stream, there is good prospect of being able to provide results within a day of most events in the second half of this decade.
However, even if the results are not yet always available within the 72-hour window required for initial search and rescue efforts, the analysis of satellite deformation data can still be useful. Various groups around the world are using these types of data (provided by COMET or processed by other groups) to build models of the event – these can in turn be used to help understand how an earthquake influences the activity on nearby faults. More directly, the data, and information derived from it such as the location of individual fault ruptures, can help responders understand the potential impact on key infrastructure such as bridges and roads, which are vital for the relief effort but might have been impacted by the surface rupture, or other slope failures resulting from the earthquake. The data also help guide field geologists to sites in the field where they can study the earthquake fault rupture up close – such features can degrade very quickly in poor weather conditions; documenting them is important for understanding what palaeoseismologists see when they are investigating records of ancient earthquake ruptures and for understanding the detail of what happened in the causative earthquake. In turn, detailed surface rupture mapping can help to add constraints to models of the earthquake based on geodetic data. In the longer-term, forensically understanding every earthquake helps us prepare for future events in different regions.
As well as providing data sets, COMET scientists, including myself, often discuss the meaning of these data sets with colleagues in open fora like twitter, and respond to queries from colleagues and the media. Leading on from comments by American seismologist and science communicator Dr Lucy Jones, my view also is that this information sharing is vital so that scientists involved directly in the response, or those involved in communication to the public, have access to the latest data and can understand what happened during an event. Often this understanding evolves quite quickly during the hours and days that follow the earthquake. Having reliable information communicated directly in platforms like twitter, and indirectly via the media, is vital for combatting misinformation and conspiracy theories that can unfortunately proliferate in the absence of reliable scientific comment. Twitter has become a key platform for many of those discussions.
Behind the scenes, we also are passing on information to local and international partners directly, so that they have the data they need to respond, and we are responding to queries to help people use the data. We are also providing data and information to help assist with the UK government’s emergency response via our partners in the British Geological Survey.
We are of course acutely conscious that our scientific responses to events like the recent earthquakes are happening in the context of humanitarian tragedies. If you are able, I encourage you to give generously to organisations such as the Disasters Emergency Committee in the UK, who are helping survivors in urgent need of aid and assistance.
*COMET is the UK Centre for the Observation and Modelling of Earthquakes, Volcanoes and Tectonics, a partnership between scientists in UK Universities and the British Geological Survey tasked with delivering National Capability science on behalf of the Natural Environment Research Council. Our focus is on using Earth Observation data alongside other data sets to help understand earthquake and volcanic processes and hazards.
Thanks to Wendy Bohon, Ruth Lawford-Rolfe, and Laura Gregory for providing input on early drafts of this text.
On 6 February, a 7.8-magnitude earthquake struck the East Anatolian Fault affecting large areas of Southern Türkiye and Northern Syria. This was followed by a 7.5-magnitude event approximately 9 hours later, around 60 miles to the north. To date more than 37,000 people are confirmed to have died, large numbers of people are affected across the region and the damage to buildings and infrastructure is significant.
Images from ESA’s Sentinel-1A satellite captured on 9/10 February clearly showed the physical effects of the earthquake on the ground, including deformation of up to 6 metres along a 300km section of the fault, and the second event causing a second ~125km rupture. Many population centres sit close to these zones, explaining the significant human impact of the event.
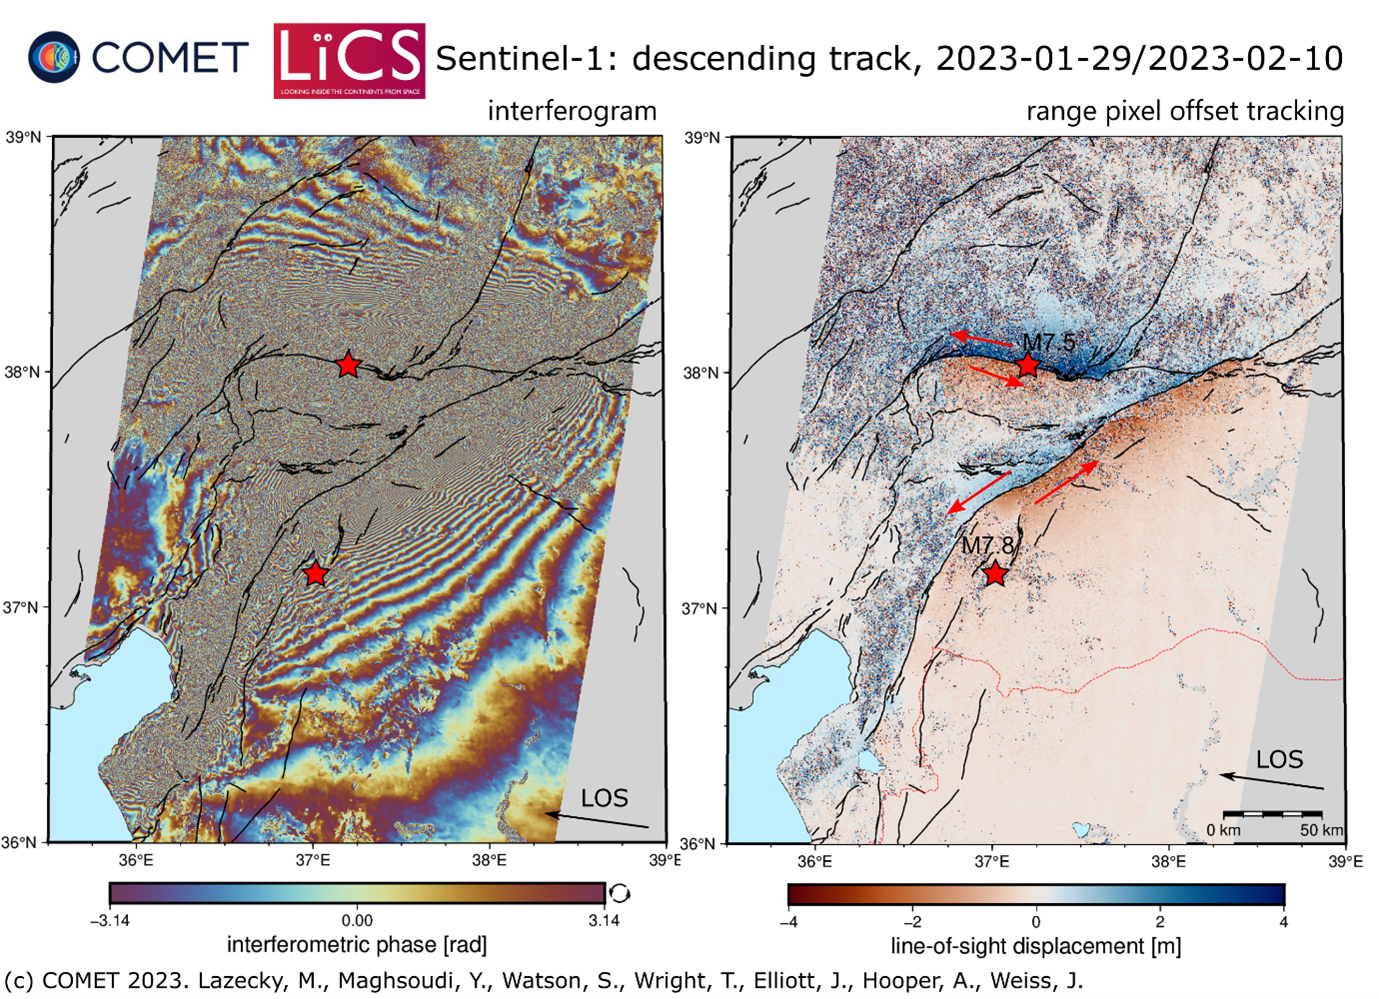
By combining Sentinel-1A imagery from before and after the earthquake, COMET scientists have been able to measure surface deformation that is clearly visible in InSAR and pixel offset tracking data sets shown below:
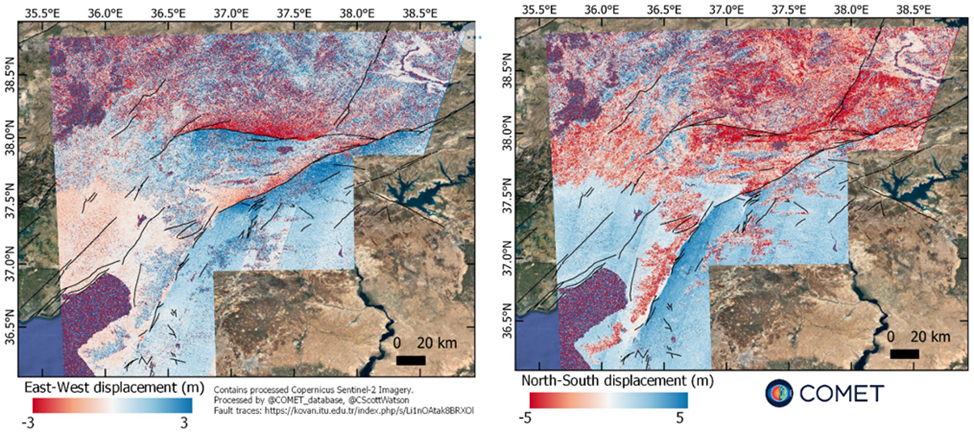
In addition to the results from the satellite radar data, we have also used the pre- and post-event optical images from Sentinel-2 to estimate ground movement in the earthquakes also using pixel tracking:
The processing outputs from Sentinel-1A data are available for download at our LiCSAR system event page. The results from Sentinel-2 are available here.
The images above contain modified Copernicus Sentinel-1 and Sentinel-2 data analysed by the Centre for the Observation and Modelling of Earthquakes, Volcanoes and Tectonics (COMET). Data processing uses JASMIN, the UK’s collaborative data analysis environment (http://jasmin.ac.uk).
For more information on why and how COMET responds to earthquake events read this article by our Director – Professor Tim Wright.
COMET – 14 February 2023
COMET researcher Tamarah King, based at the University of Oxford, has recently written a blog providing a research update on the COMET Central Asia Fault Database; progress report.
The COMET Central Asia Fault Database integrates decades of fault mapping and field-studies by researchers from the UK NERC Centre for Observation and Modelling of Earthquakes, Volcanoes and Tectonics (COMET), and global collaborators.
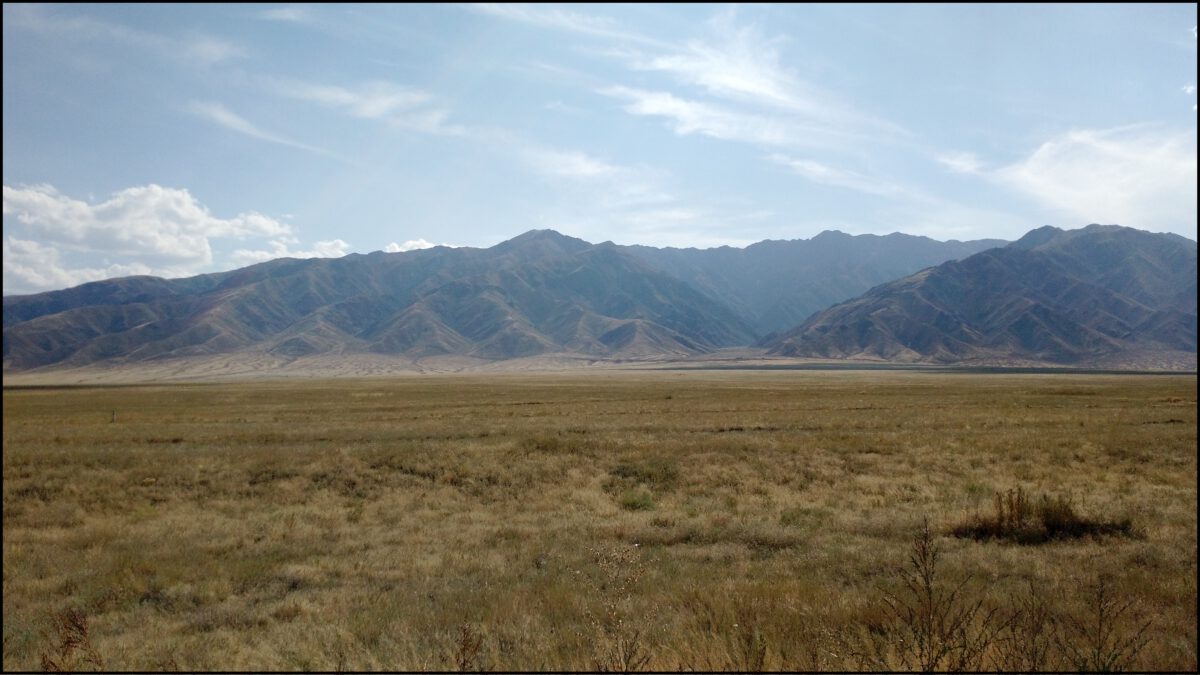
Central Asia is home to one of the world’s great mountain ranges–the Tien Shan–which is formed by vigorous crustal convergence across a multitude of tectonic faults. Here we describe the motivation to assemble the database and the choices that we have made in its structure, which are based on utility, necessity, and limitations in available information. We are working towards a full public release of the dataset, so keep an eye out!
Key points:
Background Motivation
COMET researchers have been investigating active tectonic structures across the Central Asia region since the early 2000s through programs such as Earthquakes without Frontiers and Looking Inside the Continents from Space, along with local partner institutions in the region such as the Kyrgyz Institute of Seismology. Alongside remote mapping, field campaigns with collaborators have produced a large amount of tectonic and earthquake related information. The COMET Central Asia Fault Database assembles these data to produce a cohesive fault database of use to a wide range of geoscientists, as has been done recently across other regions of the planet.
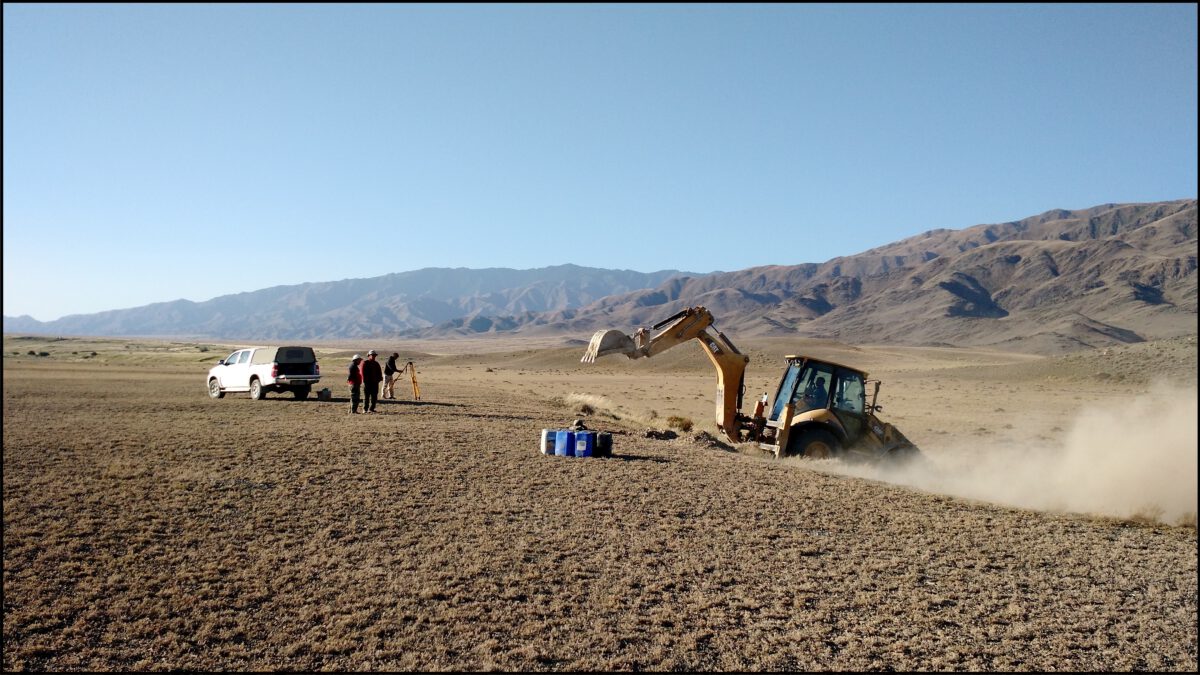
Individual contributors had mapped faults at variable times (~2000 to present), variable resolutions (field-mapping to coarse satellite imagery), and for variable purposes (field site to continental-tectonic scale studies). Rather than reduce this variability to a single representation of the fault network, we produce a database that contains three resolution levels, to increase suitability for various applications.
The blog continues at Blog – Earthquakes in Central Asia.
In the meantime, if you’d like to be involved or would like more information, please get in touch with Tamarah King via tamarah.king@earth.ox.ac.uk
COMET scientists Professor Juliet Biggs (University of Bristol) and Professor Andy Hooper (University of Leeds) both serve on the Harmony Mission Advisory Group and are delighted to have been chosen to develop the concept further.
On February 18-19, ESA’s Programme Board for Earth Observation (PB-EO) decided on the continuation of the three Earth Explorer (EE) mission candidates towards the next phase in the path to their implementation. The three missions, namely, Daedalus, Hydroterra and Harmony, were selected in 2018 for a Phase-0 feasibility study out of 21 submitted proposals. The PB-EO has made now the unprecedented decision of selecting only one mission for Phase A, namely Harmony, instead of more than one as done in previous EE calls.
The Harmony mission is dedicated to the observation and quantification of small-scale motion and deformation fields at the air-sea interface (winds, waves, surface currents), of solid Earth (tectonic strain and height changes at volcanoes), and in the cryosphere (glacier flows and height changes). In order to achieve the different mission goals, the Harmony mission shall deploy two companion satellites following one of ESA’s Copernicus Sentinel-1 satellites. The companions will be flying in two different formations (see Figure 1): the stereo formation, with one Harmony satellite placed in front and one behind Sentinel-1, in both cases at a distance of about 350 km from it; and the cross-track formation, with both Harmony units flying close to each other (~200-500 m) also at 350 km from Sentinel-1. Each Harmony satellite carries as main payload a receive-only synthetic aperture radar (SAR), which shall acquire the reflected signals transmitted by Sentinel-1 towards the Earth. A multi-view thermal infra-red payload is also included to measure cloud height and cloud motion vectors. The angular diversity provided by the Harmonies in combination with Sentinel-1 will allow the retrieval of deformation measurements of the sea and earth surface with unprecedented accuracy (see Figure 2), while the cross-track configuration will allow the accurate measurement of elevation changes for land-ice and volcanic applications.
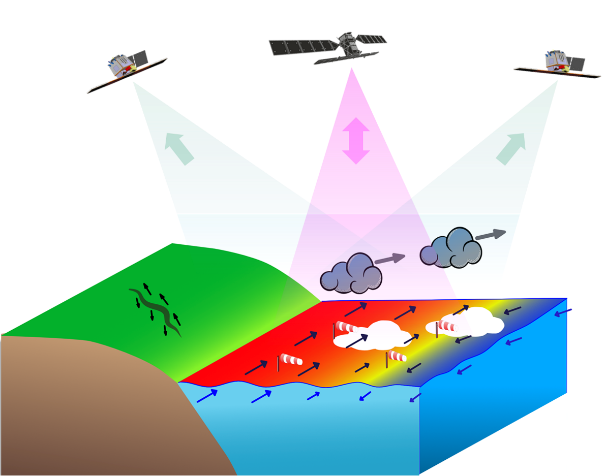
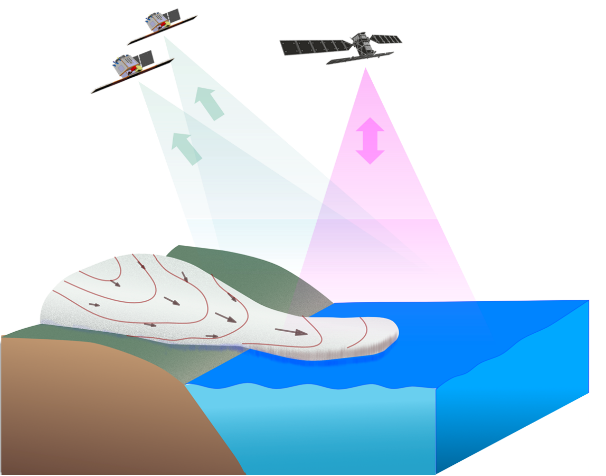
Figure 1: Representation of the (left) stereo and (right) cross-track flying formations for Harmony. The Sentinel-1 satellite is depicted in black color. Sentinel-1 transmits a signal and acquires the backscattered echoes (represented with magenta arrows), while the Harmony satellites receive part of the energy that bounces towards them (represented with the green arrows). Copyright: Harmony Mission Advisory Group.
Dr. Paco López-Dekker from the Delft University of Technology and principal investigator of the Harmony mission, comments “It is very exciting that our multi static-SAR concept, which combines many ideas that were matured during my years at HR, has made it to this final stage. During Phase-0 we have drafted a beautiful and elegant mission concept promising an unprecedented view at Earth System processes. Now we have the responsibility to look at it from all sides and be sure that it will work. Challenging and fun.”
Professor Juliet Biggs from the University of Bristol and member of Harmony’s Mission Advisory Group at ESA adds “The Harmony mission is remarkable in that it promises new scientific discoveries across an astonishing breadth of topics: from the gradual motion of tectonic plates to small-scale processes on the ocean surface. I’m delighted that we have been selected to develop the concept further and that Harmony is one step closer to becoming a reality”
Dr. Pau Prats, from the German Aerospace Centre, DLR and member of Harmony’s Mission Advisory Group at ESA, is convinced of the benefits a mission like Harmony will bring to the community: “The unique configuration of the Harmony satellites in combination with Sentinel-1 will allow us to literally add a new dimension to SAR observations, a fact that will foster SAR technology and its applications during the next two decades.”
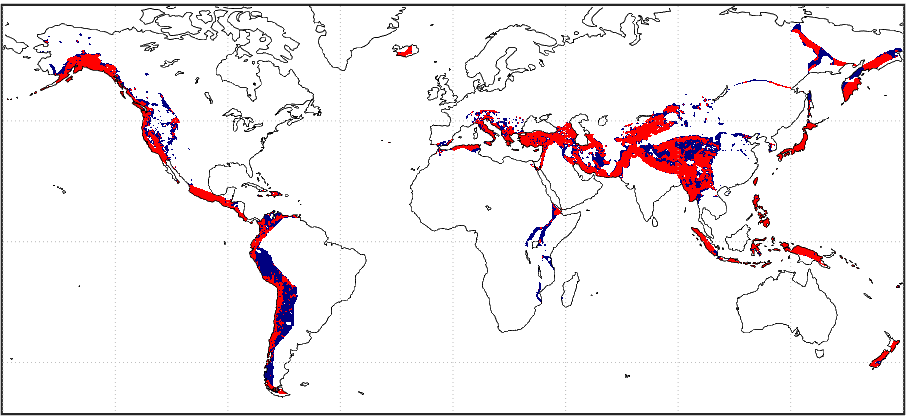
Figure 2: Coloured areas show regions straining at greater than 10 nanostrain per year (the threshold above which 95% of earthquake fatalities occur). Blue regions are those that have a small component of north-south strain and can be imaged by Sentinel-1 alone. Red regions indicate the extra area that will be constrained by Harmony. From Harmony Report for Assessment. 2020.
So, what’s next? Even though Harmony is currently the only EE-10 mission candidate it does not mean it will be implemented. The industry and science teams have one and a half years of hard work ahead to demonstrate the mission has reached the technological and scientific level of maturity required to enter into the next phase, that will ultimately result in the launch of the Harmony satellites by the end of this decade.
Announcement can be found on ESA website: https://www.esa.int/Applications/Observing_the_Earth/ESA_moves_forward_with_Harmony
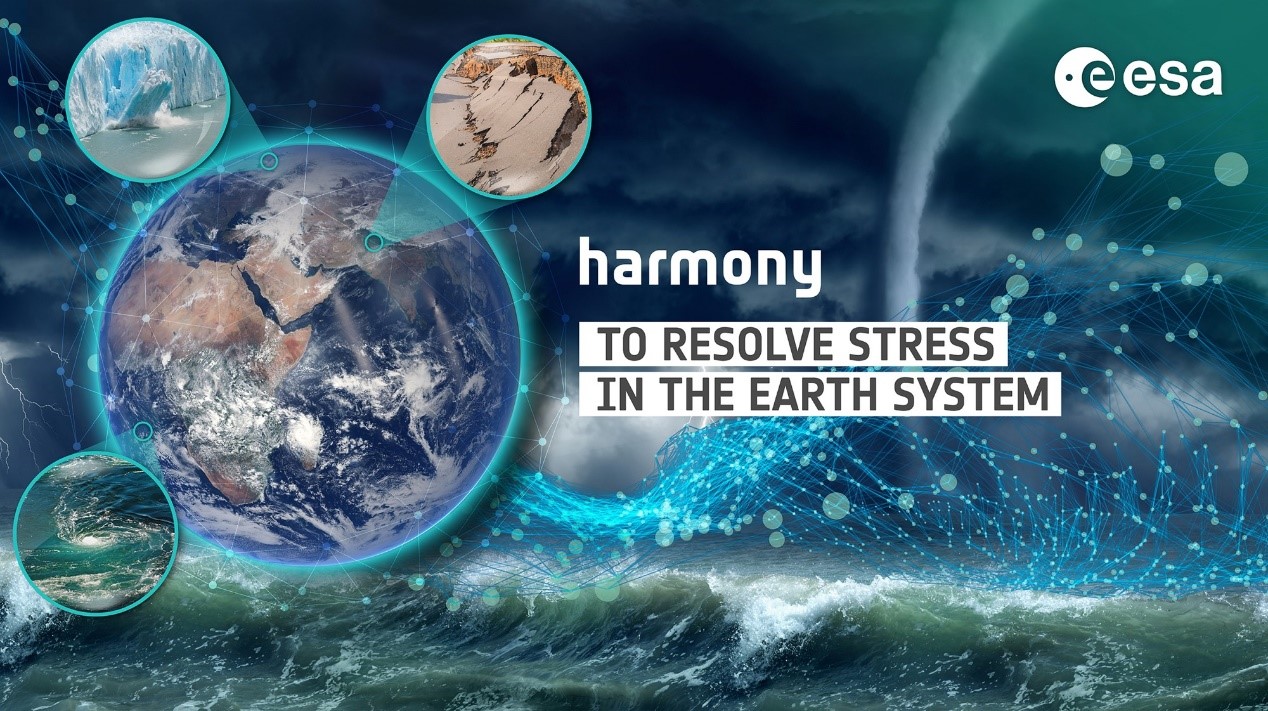
Title figure for the Harmony mission. Copyright: ESA.
The timing and size of three deadly earthquakes that struck Italy in 2016 may have been pre-determined, according to new research published in Earth and Planetary Science Letters that could improve future earthquake forecasts.
A joint British-Italian team of geologists and seismologists have shown that the clustering of the three quakes might have been caused by the arrangement of a cross-cutting network of underground faults.
The findings show that although all three earthquakes occurred on the same major fault, several smaller faults prevented a single massive earthquake from occurring instead and also acted as pathways for naturally occurring fluids that triggered later earthquakes.
The cluster of three earthquakes, termed a “seismic sequence” by seismologists, each had magnitudes greater than six and killed more than 300 people in Italy’s Apennine mountains between 24 August and 30 October 2016.
Earthquake sequences
The research, led by COMET scientist Richard Walters from Durham University, comes on the second anniversary of the start of the earthquake sequence.
The researchers say the findings could have wider implications for the study of seismic hazards, enabling scientists to better understand potential earthquake sequences following a quake.
Dr Walters said: “These results address a long-standing mystery in earthquake science – why a major fault system sometimes fails in a single large earthquake that ruptures its entire length, versus failing in multiple smaller earthquakes drawn-out over months or years.
“Our results imply that even though we couldn’t have predicted when the earthquake sequence would start, once it got going, both the size and timing of the major earthquakes may have been pre-determined by the arrangement of faults at depth.
“This is all information we could hypothetically know before the event, and therefore, this could be a hugely important avenue for improving future earthquake forecasts.”
Thousands of aftershocks
Dr Walters and the team used satellite data to estimate which part of the fault failed in each earthquake, and compared this pattern with the location and timing of thousands of tiny aftershocks throughout the seismic sequence.
They found that intersections of small faults with the main fault system separated each of the three largest earthquakes, strongly suggesting these intersections stop the growth of each earthquake and prevent the faults failing in a single large event.
In addition, the scientists also found that after the first earthquake, thousands of aftershocks crept northwards along these same fault intersections at a rate of around 100 metres per day, in a manner consistent with naturally occurring water and gas being pumped along the faults by the first earthquake on 24 August, 2016.
The second earthquake, on the 26 October, occurred exactly when these fluids reached its location, therefore controlling the relative timing of failure.
Dr Walters added: “It was a big surprise that these relatively small faults were having such a huge influence over the whole sequence.
“They stop the first earthquake in its tracks, and then they channel the fluids that start the sequence up again months later. No-one’s ever seen this before.”
Seismic hazard
Co-author and COMET associate Dr Laura Gregory from the University of Leeds said it was important to understand whether or not a fault fails in a seismic sequence, and that the team’s results were only made possible by combining a varied array of different datasets.
Dr Gregory said: “A seismic sequence has vastly different implications for seismic hazard compared to a single large earthquake. If the faults in Italy in 2016 had failed together in one big event, the impact on the local population would have been much worse.
“This is the first time we’ve ever had this quality of modern data over one of these earthquake sequences, and bringing together a range of specialists was key for unpicking how the earthquakes related to one another.
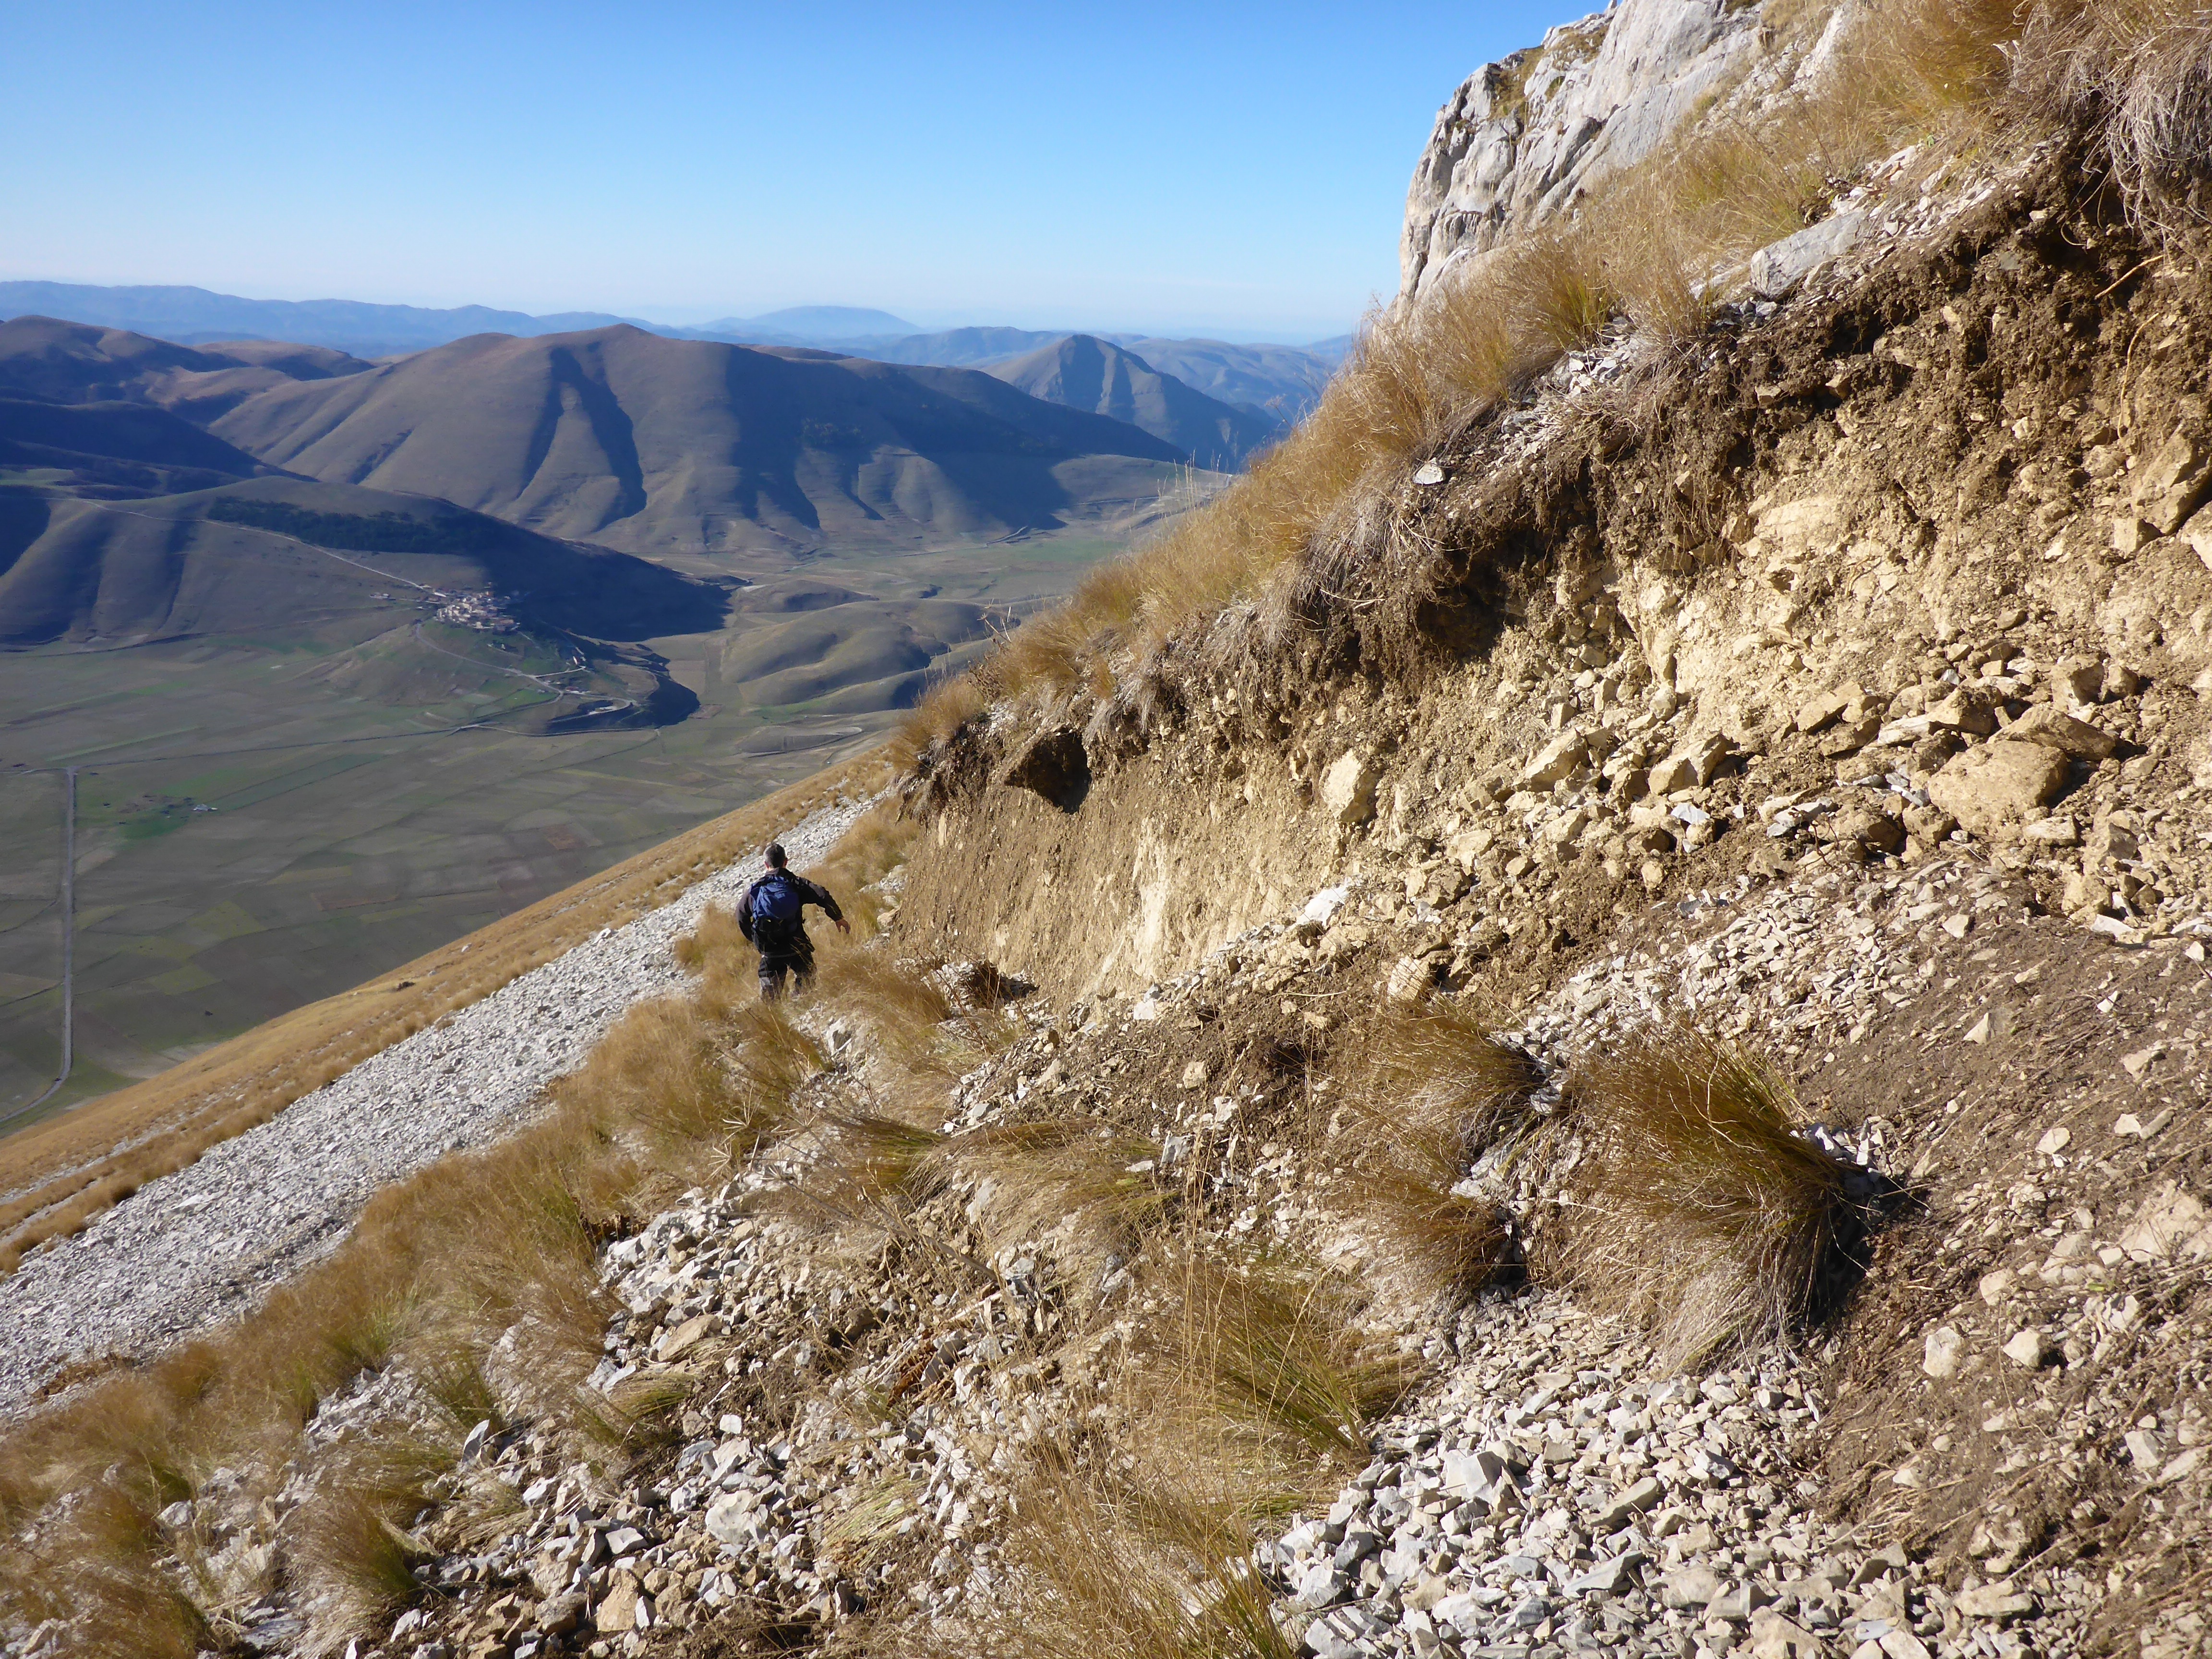
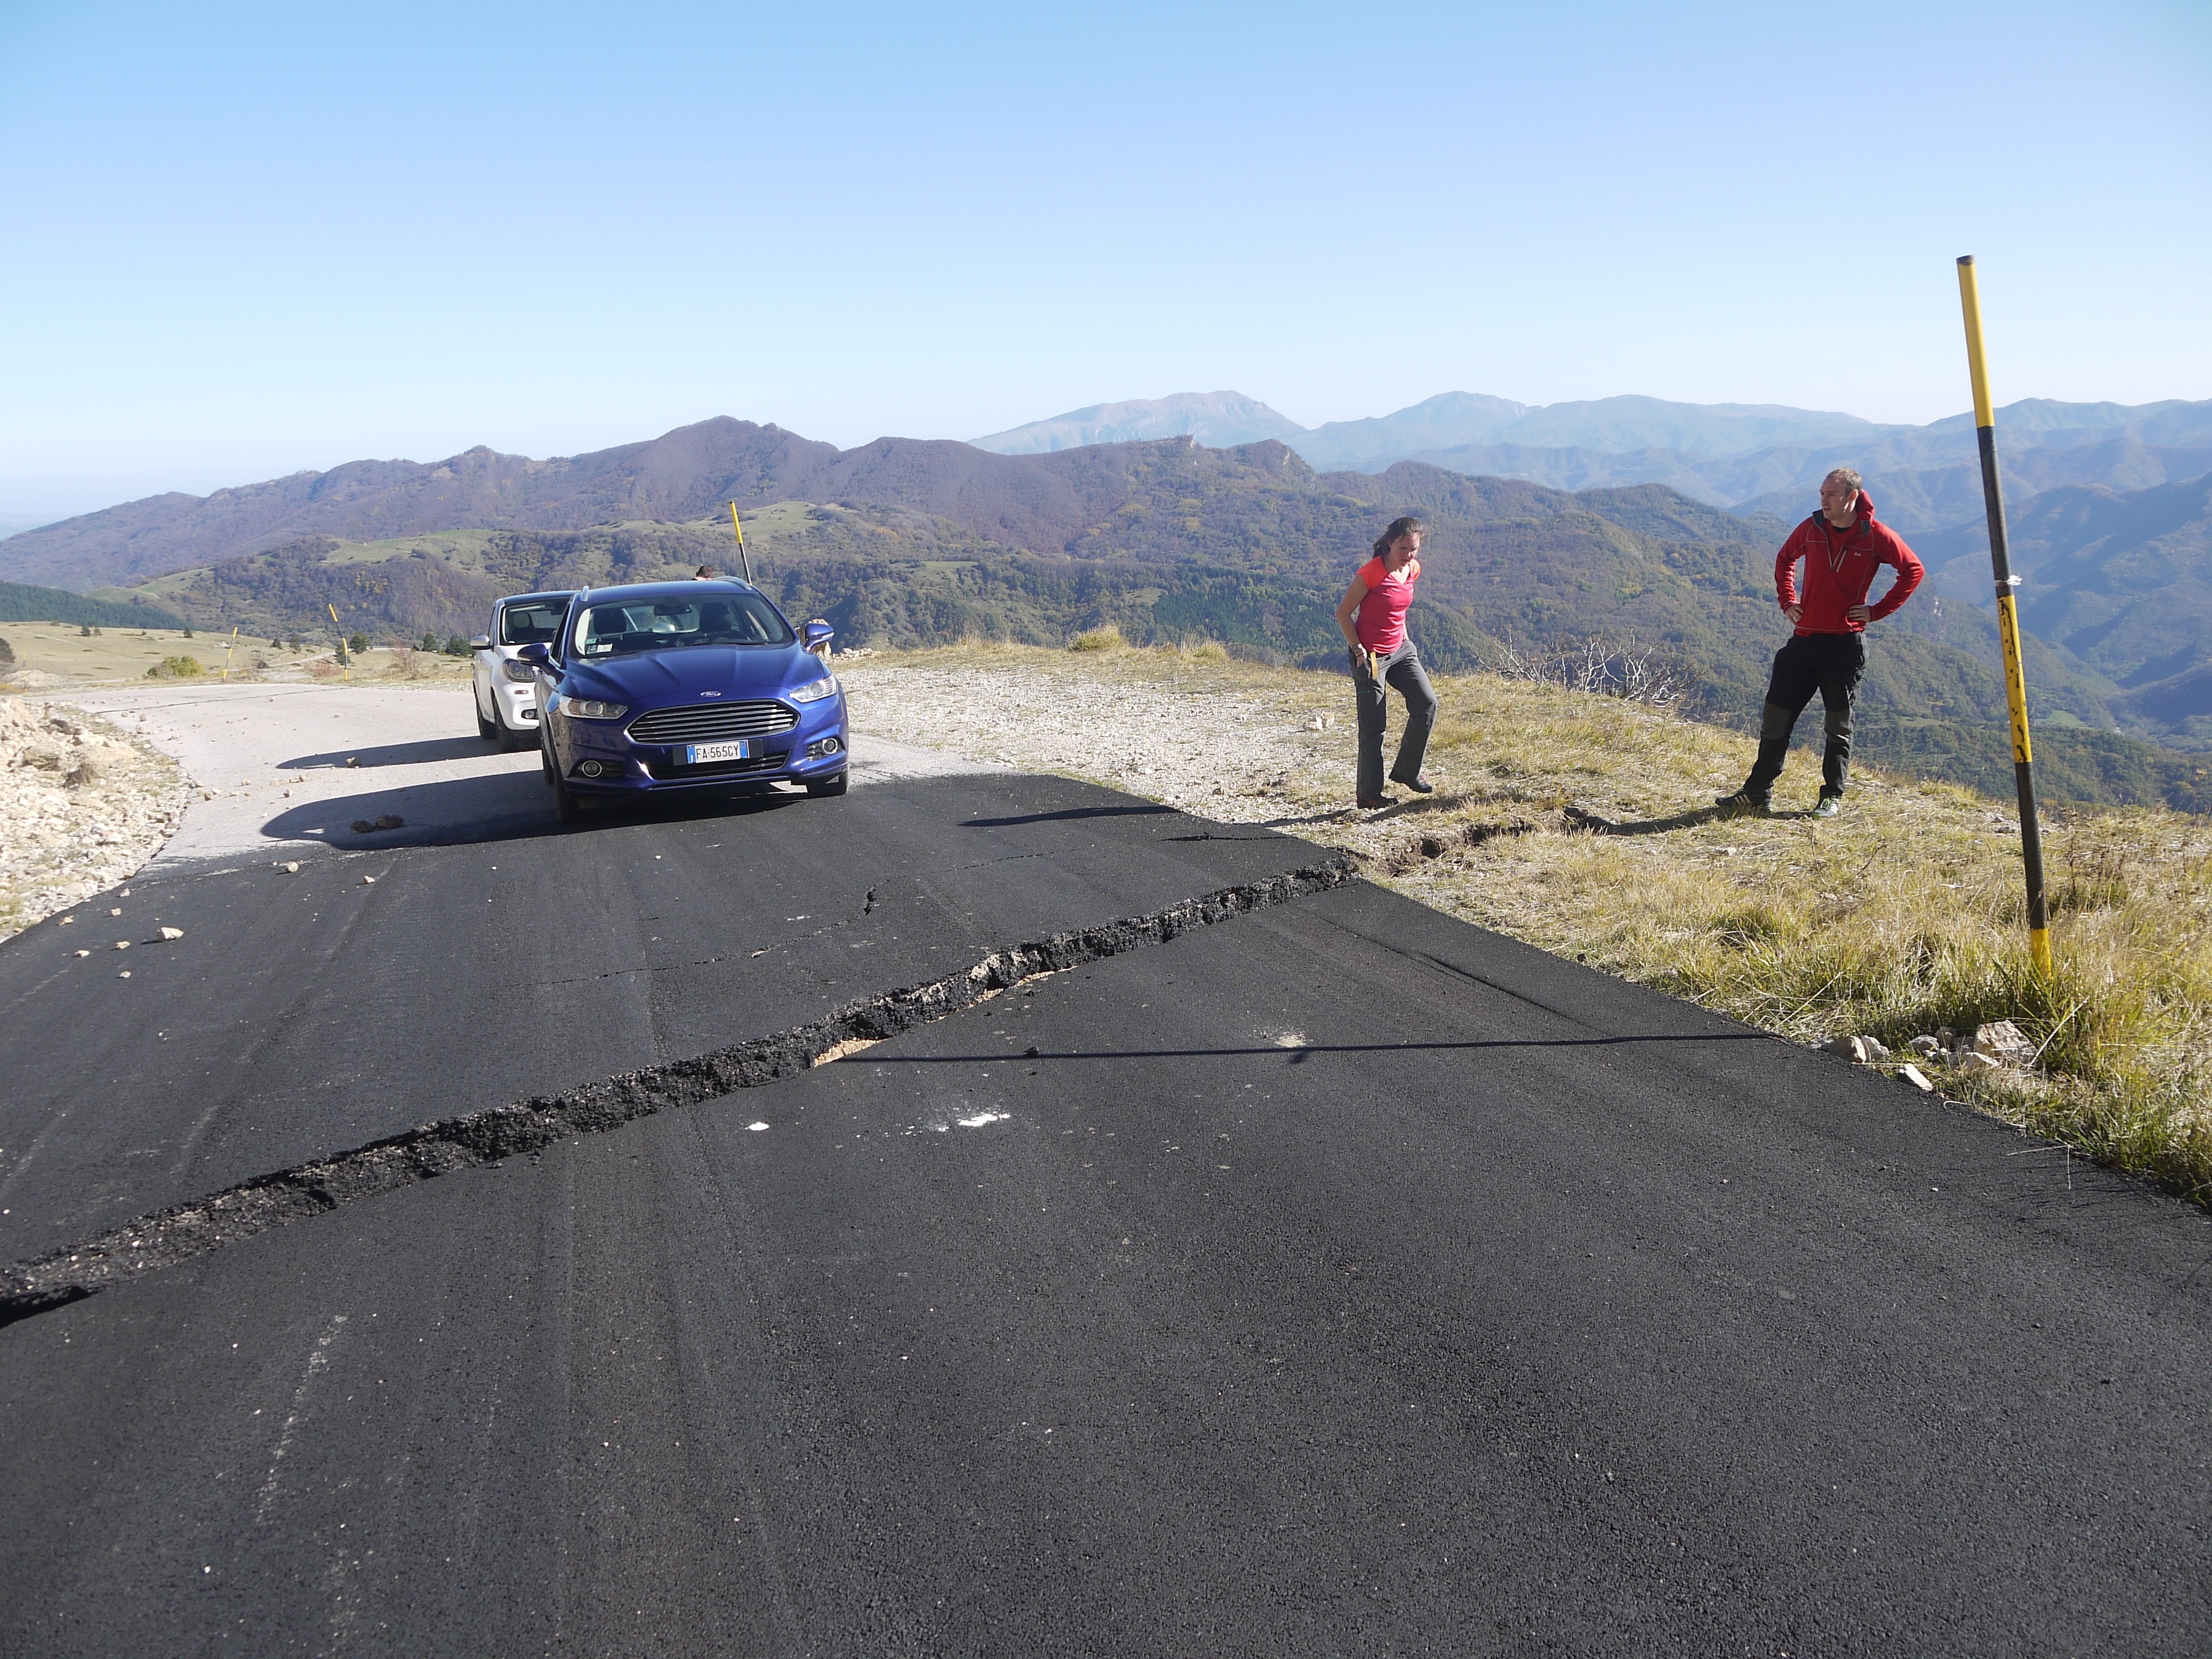
“I was scrambling over the mountainside immediately after each earthquake with British and Italian colleagues, measuring the metre-high cliffs that had suddenly formed. Meanwhile, other members of our team were analysing data from seismometers stationed around the world, or were mapping the tiny bending of the ground around the faults using satellites orbiting the planet at 500 miles altitude.”
The research was partly supported by both COMET and a NERC Urgency Grant.
Satellite data has shed new light on seismic hazard in one of the world’s most deadly earthquake zones.
Published today in Nature Communications, the COMET study describes how tectonic strain builds up along Turkey’s North Anatolian Fault at a remarkably steady rate.
This means that present-day measurements can not only reflect past and future strain accumulation, but also provide vital information on events still to come.
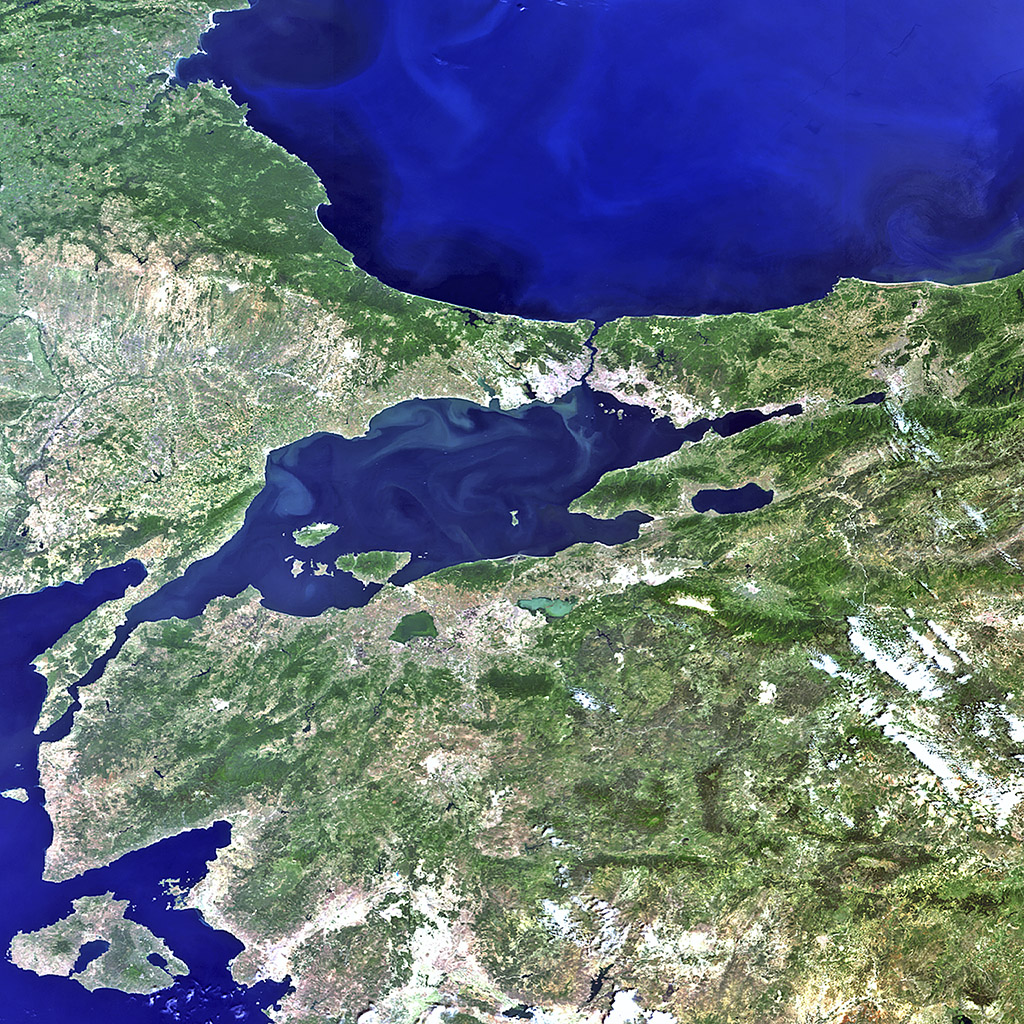
The strain, which builds up as Turkey is squeezed between three major tectonic plates, has caused almost the entire length of the fault to rupture since 1939 in a series of major earthquakes gradually migrating east-west towards Istanbul.
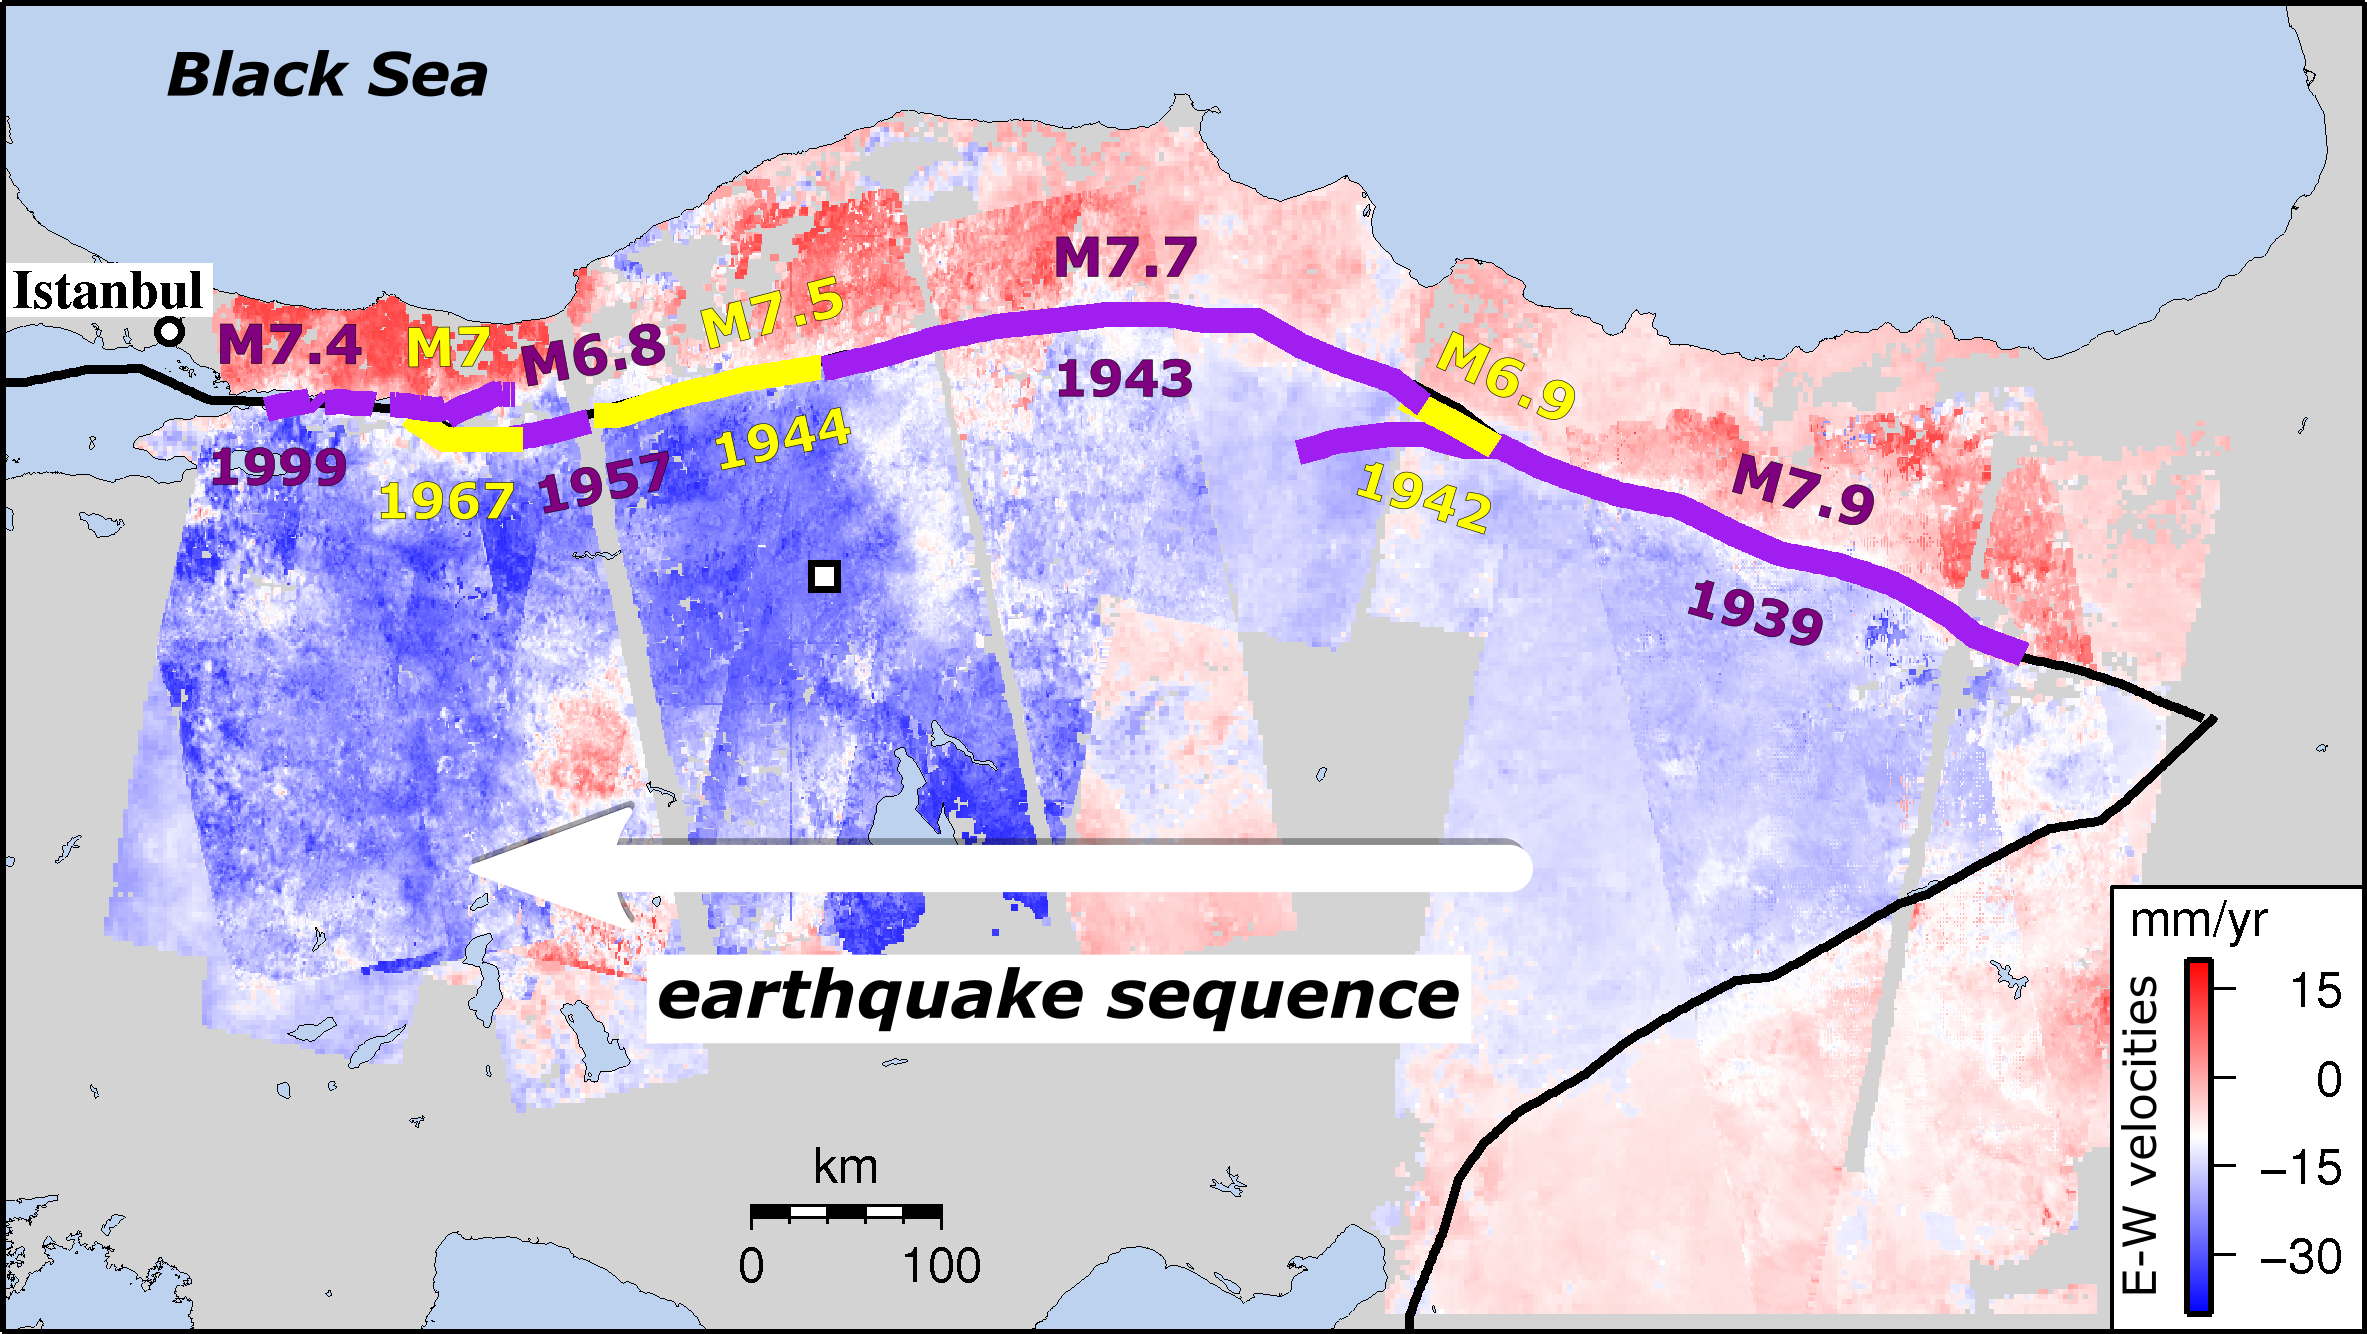
Led by COMET PhD student Ekbal Hussain[1], the team used satellite images from the European Space Agency’s Envisat mission to identify tiny ground movements at earthquake locations along the fault.
Dr Hussain explained: “Because we know so much about the fault’s recent history, we could look at the strain build up at specific places knowing how much time had passed since the last earthquake.”
The 600-plus satellite images, taken between 2002 and 2010, provided insights into the equivalent of 250 years of the fault’s earthquake repeat cycle.
Remarkably, apart from the ten years immediately after an earthquake, strain rates levelled out at about 0.5 microstrain per year, equivalent to 50mm over a 100km region, regardless of where or when the last earthquake took place.
Dr Hussain added: “This means that the strain rates we measure over the short term can also reflect what’s happening in the longer term, telling us how much energy is being stored on the fault and could eventually be released in an earthquake.”
Until the satellite era, it was difficult to get a clear picture of how strain built up on the fault. Now, satellites like Envisat, alongside the newer Sentinel-1 mission, can detect ground movements of less than a millimetre, indicating how and where strain is accumulating.
The findings suggest that some existing hazard assessment models, which presume that strain rates vary over time, need to be rethought. This is especially true for regions where there are long gaps between earthquakes, such as the Himalayas.
Co-author and COMET Director Tim Wright said: “Discovering this consistent strain accumulation will help us to reassess how we model seismic hazards, as well as improving understanding of the earthquake cycle worldwide.”
The full paper is: Hussain et al. (2018) Constant strain accumulation rate between major earthquakes on the North Anatolian Fault, Nature Communications, doi:10.1038/s41467-018-03739-2
[1] Now Remote Sensing Scientist at BGS Keyworth. Dr Hussain is available for comment (ekhuss@bgs.ac.uk).
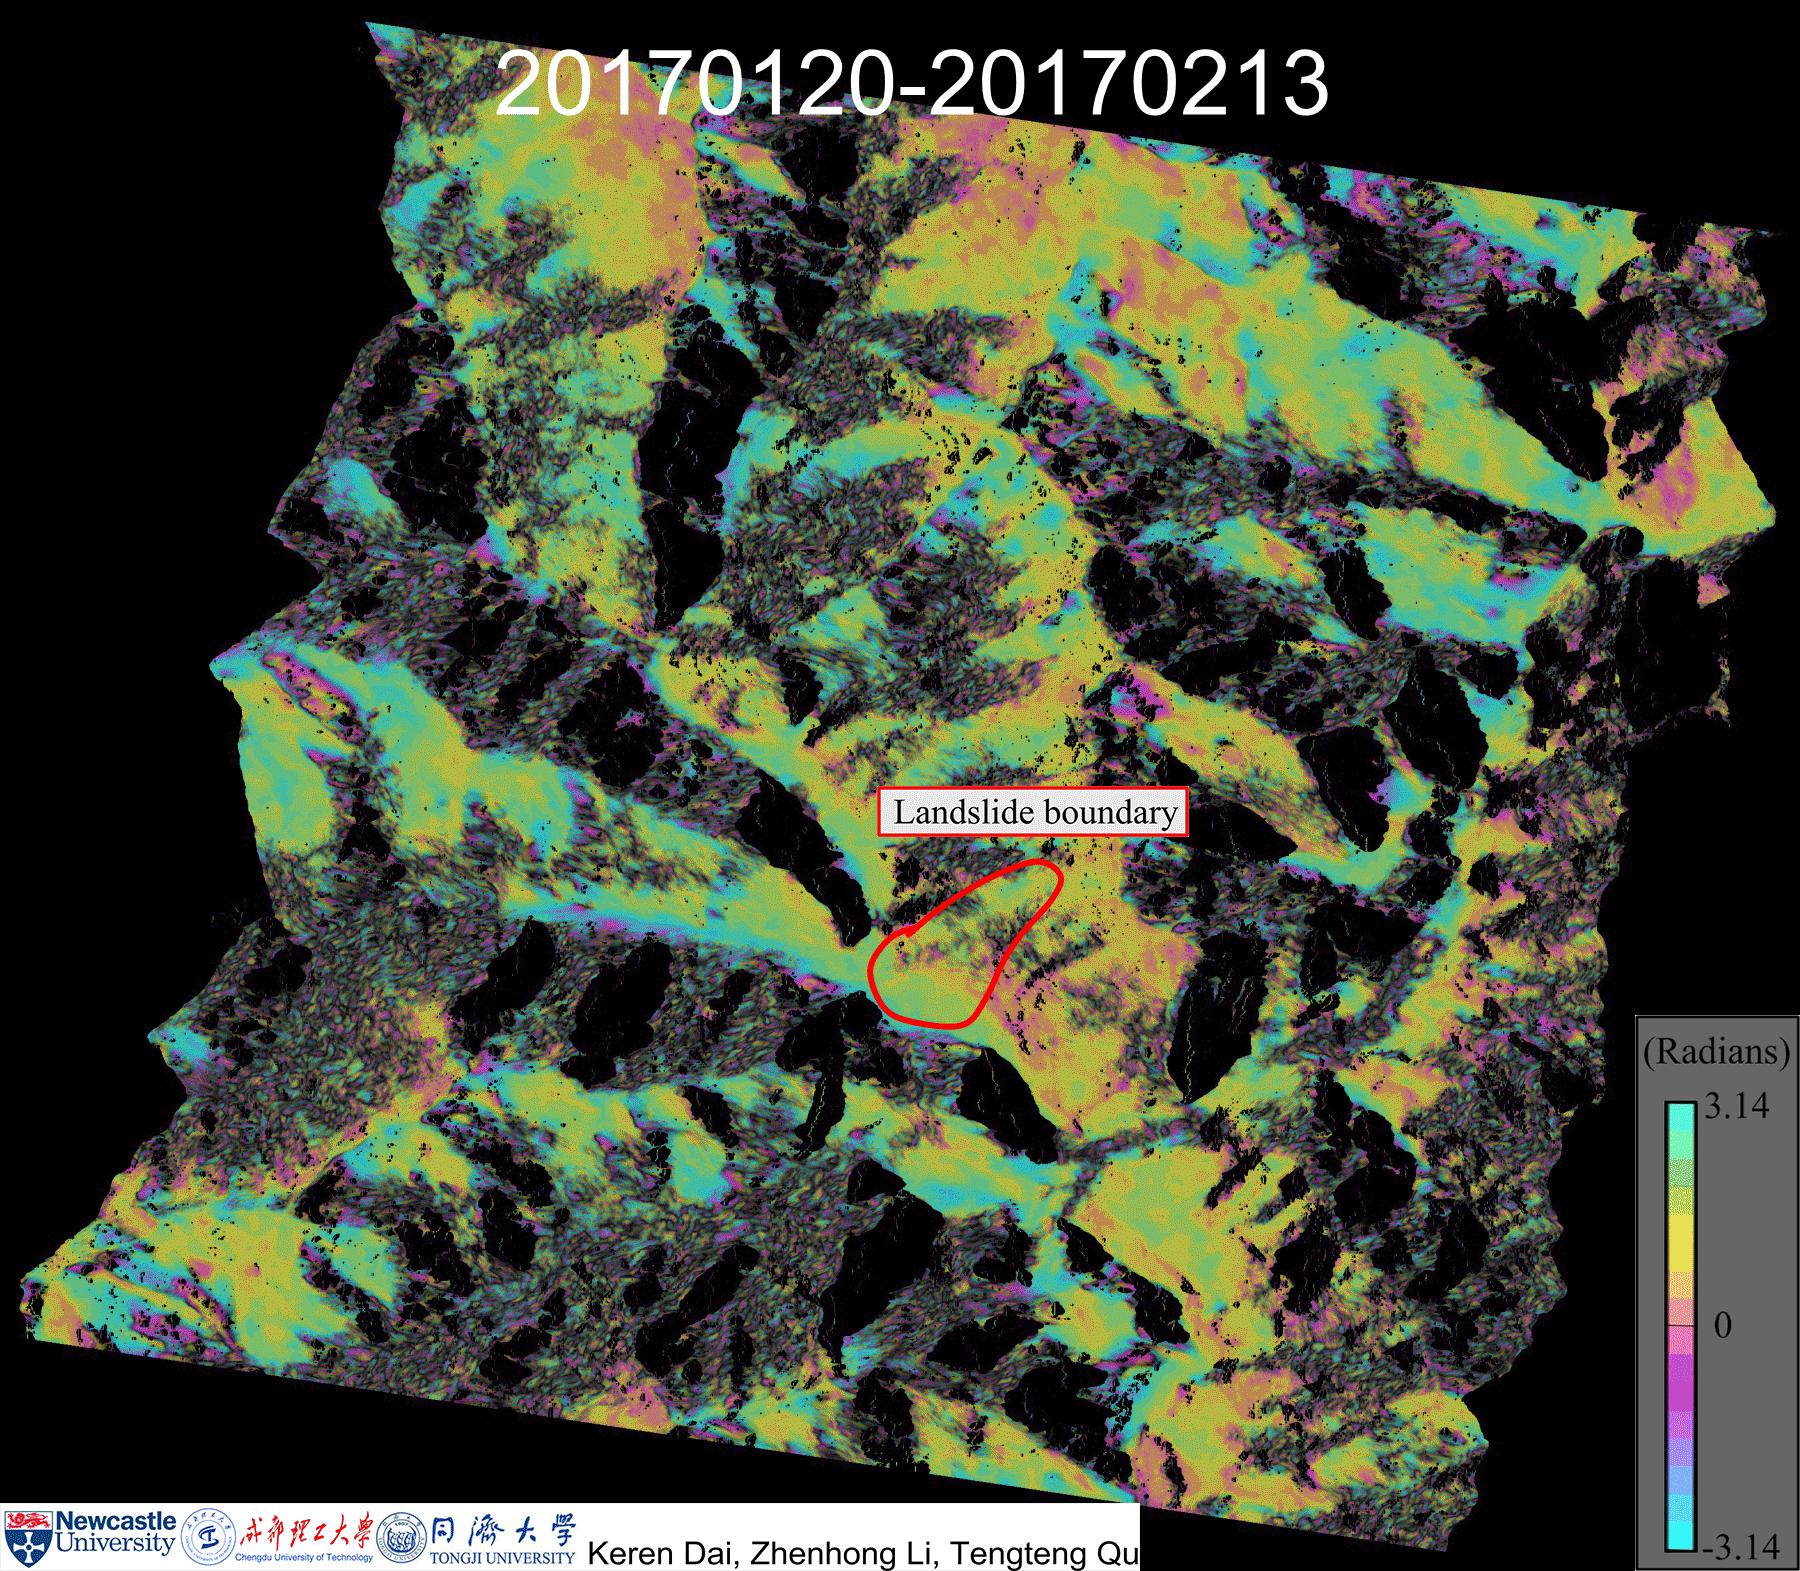
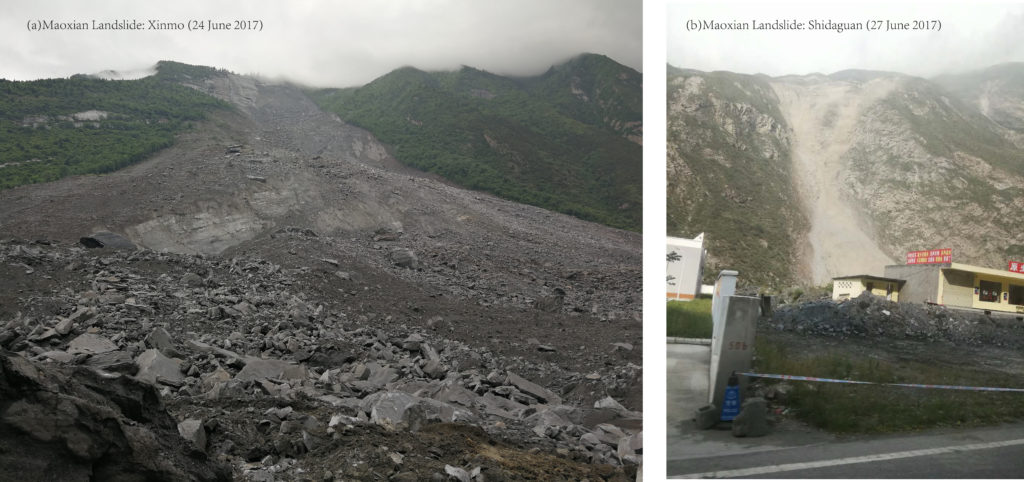
At about 5:38am local time on 24 June 2017 (21:38 on 23 June 2017 UTC), a massive landslide struck Xinmo Village, Maoxian County, Sichuan Province in China. Sichuan province is prone to earthquakes, including the 2008 Mw 7.9 Wenchuan earthquake that killed over 70,000 people, as well as the 1933 Mw 7.3 Diexi earthquake with a death toll of up to 9300.
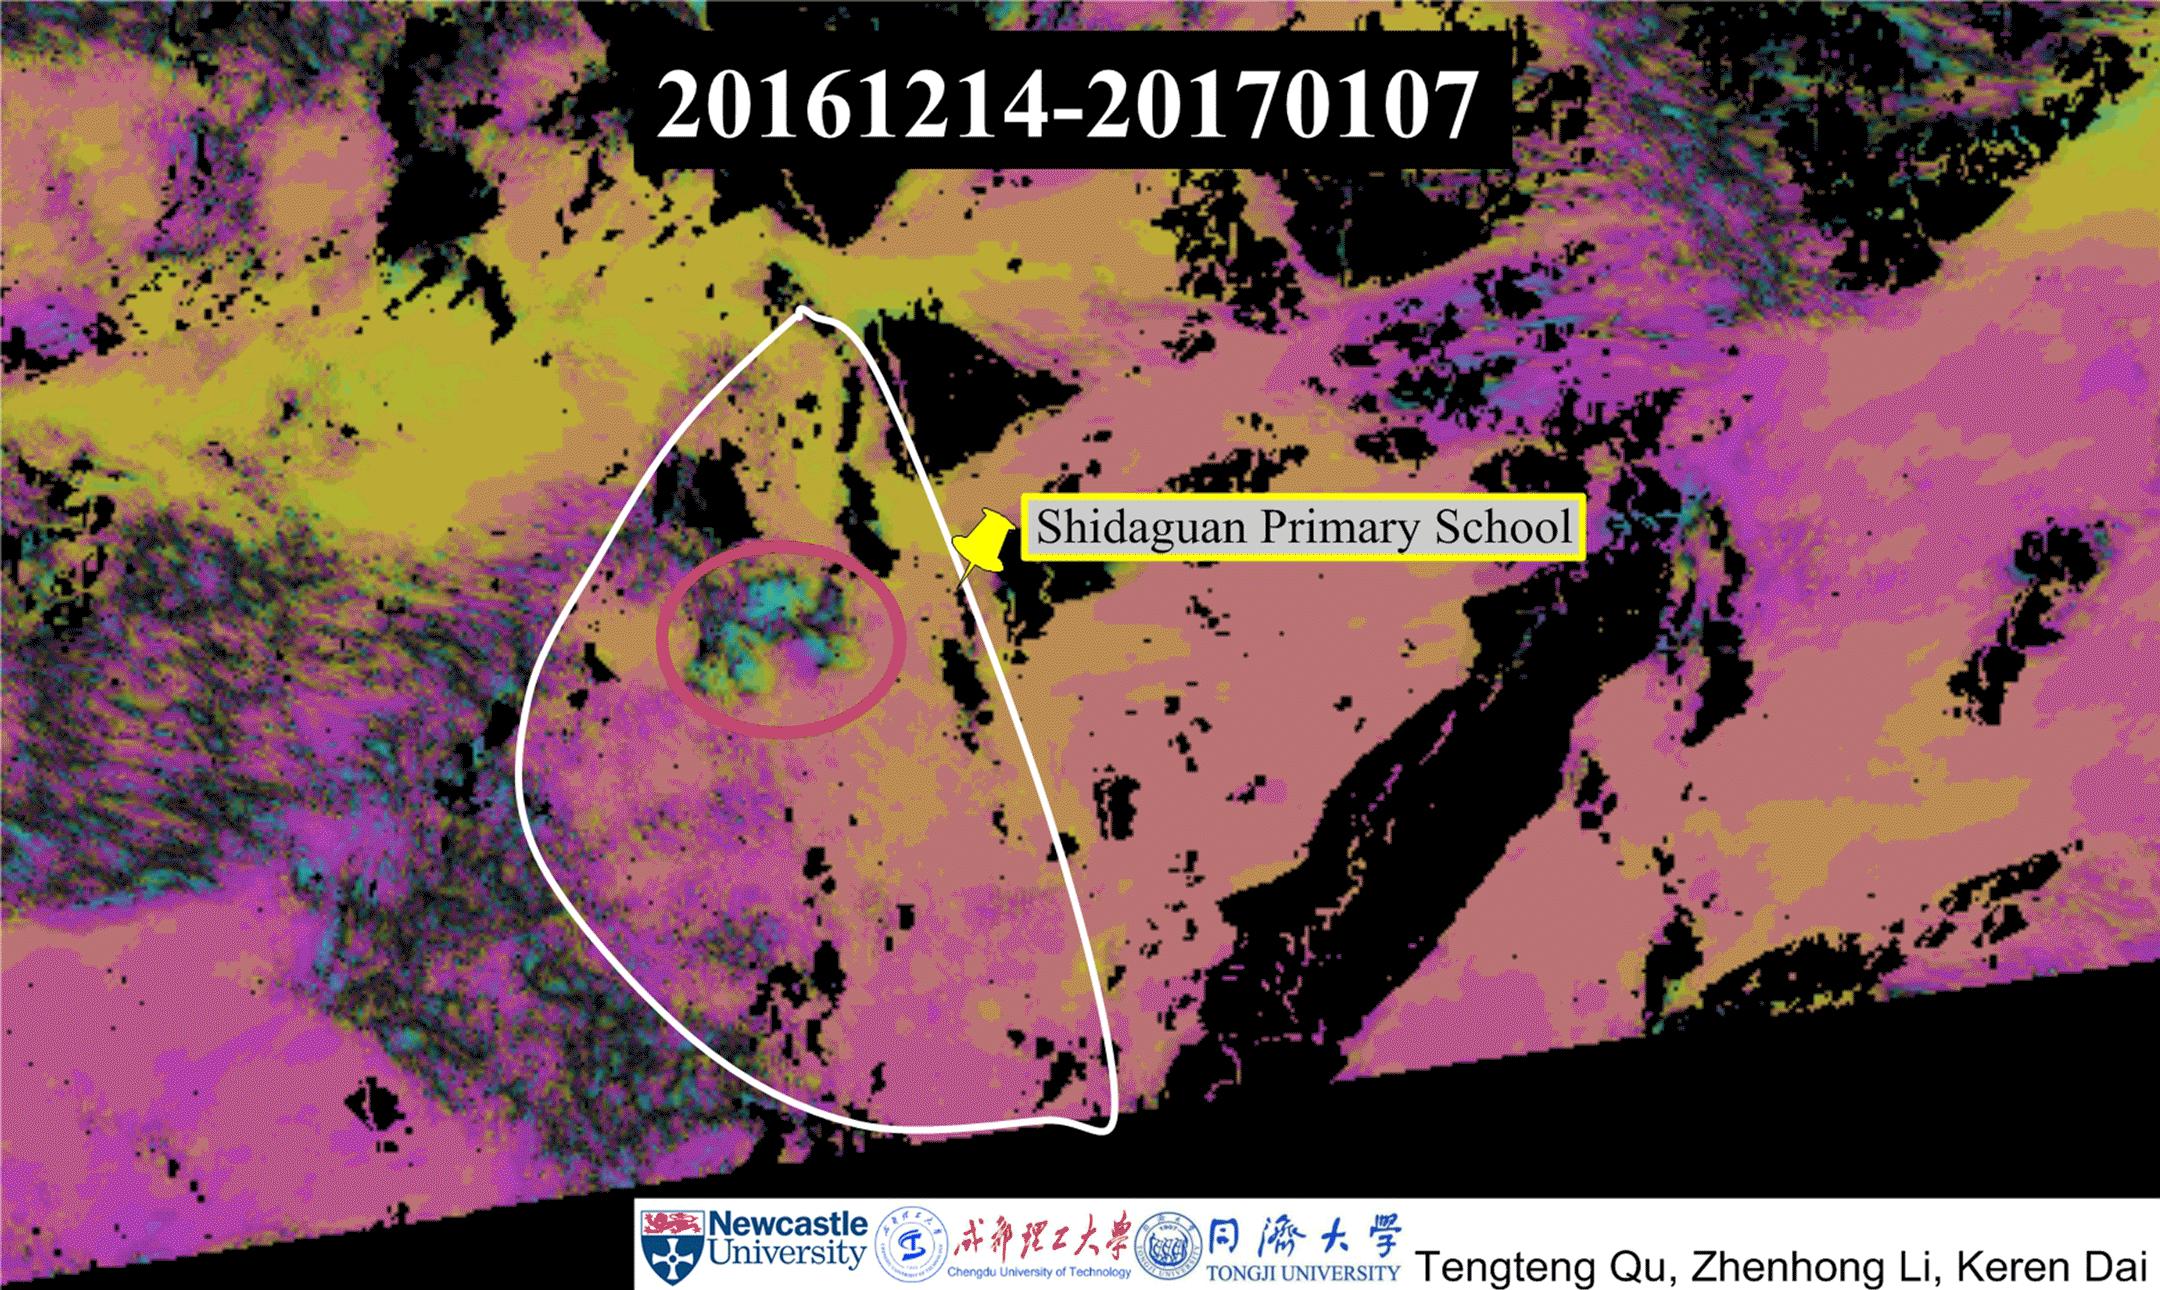
Authorities have confirmed that the Maoxian landslide was triggered by heavy rain. The Maoxian landslide swept 64 homes in Xinmo village, blocking a 2km section of river and burying 1,600 meters of road. The collapsed rubble was estimated to be about eight million cubic meters (Figure 1a). Three days later (on 27 June 2017), a second landslide hit Xinmo Village; almost in the same time, another landslide occurred in Shidaguan Town, 20km away from Xinmo Village (Figure 1b).
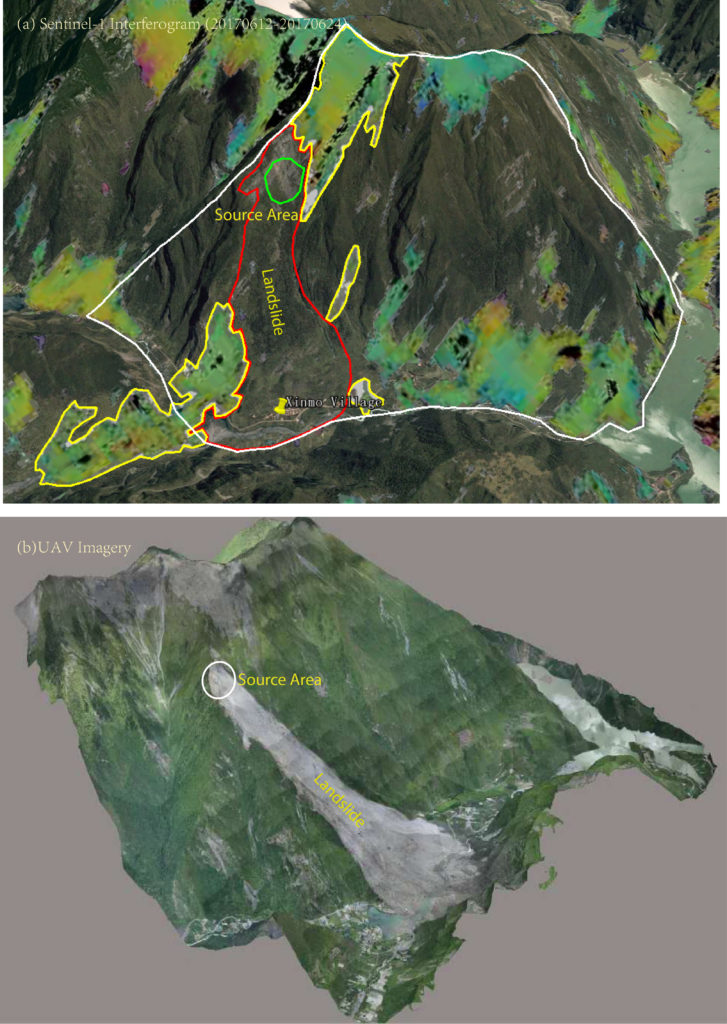
As part of the ESA’s Copernicus Program, the Sentinel-1 mission comprises a constellation of two polar-orbiting satellites, operating day and night performing C-band synthetic aperture radar imaging in all-weather conditions. Sentinel-1 images acquired before and after events such as landslides, earthquakes or volcanoes offer information on the extent and surface displacements of affected areas, which can be used for damage and future hazard assessment.
A joint team from Newcastle University (UK), Chengdu University of Technology, Tongji University, China Academy of Space Technology and Wuhan University (China) have been racing against time to respond these two events by combining ESA’s Sentinel-1, Chinese Gaofen-2/3 with field observations.
“Sentinel-1 acquired a post-event image thirteen and half hours after the Xinmo event, and provided us the first interferogram for the Xinmo landslide.” said Professor Zhenhong Li, Professor of Imaging Geodesy at Newcastle University, “This first Sentinel-1 interferogram, together with its corresponding coherence and amplitude maps, not only helped us identify the source area of this massive landslide, but also assisted with mapping the landslide boundary (Figure 2).”
“More importantly, through the analysis of the archived Sentinel-1 data, we found that pre-event movements exhibited in the source area during the period from 14 May to 19 June 2017 for the Xinmo event.”
Pre-event signals are even clearer for the Shidaguan landslide, suggesting it had been sliding for a while.
“It is well known that landslides are hard to predict” said Professor Qiang Xu, Geologist with Chengdu University of Technology, “This study convincingly demonstrates that InSAR can be used to detect and map active landslides, which is a great achievement.”
After presenting the joint research findings in the Dragon-4 symposium at Copenhagen on 27 June 2017, Professor Deren Li, Academician of Chinese Academy of Sciences (CAS) and Chinese Academy of Engineering (CAE) at Wuhan University concluded, “This joint effort suggests that landslide Early Warning System (EWS) might be encouraging. There are a range of factors we should consider for EWS, such as real time, automatic, spatial and temporal resolutions, and data uncertainty.”
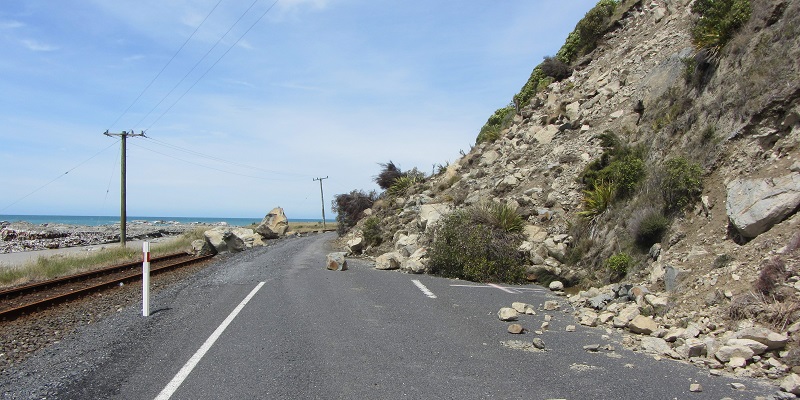
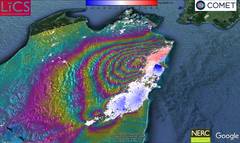
Dramatic data from last year’s major earthquake in Kaikoura, New Zealand, will change the way scientists think about earthquake hazards in tectonic plate boundary zones.
The South Island earthquake was one of the most comprehensively recorded earthquakes in history. Satellite images of the earthquake and its aftermath have enabled scientists to analyse the quake in an unprecedented level of detail.
COMET Director Tim Wright, study co-author, said: “We’ve never seen anything like the Kaikoura quake before, it was one of the most complex ever recorded.
“An earthquake commonly ruptures across a single fault line or faults that are closely grouped; Kaikoura ruptured at least 12 major faults. This challenges many assumptions about how individual faults control earthquake ruptures.”
Immediately following the start of Kaikoura’s earthquake in November, the Sentinel-1 and ALOS-2 satellites were tasked with gathering images and data. COMET researchers at the University of Leeds used the data to provide a rapid analysis of what was happening during the quake.
They found that seismic readings of the earthquake were not giving accurate assessments of where the ruptures were occurring.
Professor Wright said: “Seismic readings are currently the fastest method of gathering earthquake data as they can quickly read shockwaves sent through the earth – but they paint a crude picture. The complexity of the Kaikoura earthquake caused seismologists to completely misinterpret the earthquake based on these seismic waves.
“Satellites such as the European Space Agency’s Sentinel-1 measure the way the ground deforms at very high resolution. The detail in the images showed us that ruptures took place across many separate faults.
“One of the aims of COMET is to expand satellite capability to provide rapid response earthquake data to ensure residents and rescue workers have access to fast and accurate information.”
The satellites provided pre- and post-earthquake images to measure the extent of land movement. Kaikaoura’s earthquake caused sections of earth to move up to 25 metres and created surface ruptures measuring 12 metres. This caused large scale landslides and triggered a tsunami.
In a study published today in Science, the team of researchers reports the full range of data analysed from Kaikaoura’s earthquake, including satellite imagery, field observation, GPS data and coastal uplift data.
The research will prompt reassessment of how many different faults can be involved in a single earthquake and could potentially feed into revaluations of seismic hazard models.
Lead researcher Dr Ian Hamling, a natural hazards geodesist from New Zealand research institute GNS Science, said: “There was growing evidence internationally that conventional seismic hazard models are too simple and restrictive.
“The message from Kaikoura is that earthquake science should be more open to a wider range of possibilities when rupture models are being developed. It underlines the importance of re-evaluating how rupture scenarios are defined for seismic hazard models.”
New Zealand’s complex network of faults are similar to those found in western United States, Japan and central Asia.
Leeds co-author and COMET Associate Dr John Elliott said: “While earthquakes like Kaikoura’s do not commonly occur, the data we’ve gathered from this event will expand our understanding of similar boundary zones around the world.
“Not only could the data help inform us for the future but it may change how we’ve interpreted ancient earthquakes. If an earthquake like Kaikoura’s took place thousands of years ago, current methods of paleo-seismology would possibly see it as a series of earthquakes over a long period of time, rather than as one large single quake.”
The full paper, ‘Complex multi-fault rupture during the 2016 M7.8 Kaikoura earthquake, New Zealand’ was published on 23 March in Science First Release.