
Despite a lack of eruptive surface activity since 2010, Soufrière Hills volcano continues to show signs of unrest in the form of ongoing outgassing, and inflation of the entire island of Montserrat.
From 1995, Soufrière Hills volcano on Montserrat, West Indies, showed a pattern of inflation and deflation which ended with a partial dome collapse in February 2010. Since then, the eruptive activity has been characterised by constant outgassing and the occasional seismic swarms that are accompanied by short-lived venting of volcanic ash. However, the inflation of the entire island of Montserrat indicates that the eruption is far from over and that fresh magma is accumulating in a reservoir below the island.
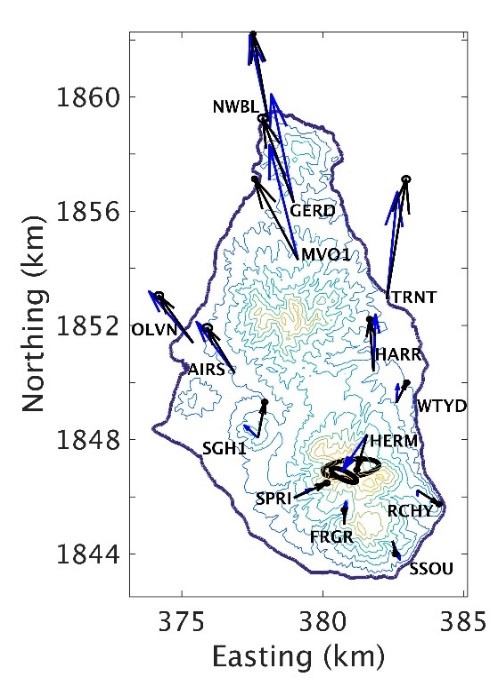
Together with Amy Collinson (Postdoctoral Researcher, Leeds) Professor Jurgen (Locko) Neuberg worked with Karen Pascal at the Montserrat Volcano Observatory (MVO), who is in charge of deformation monitoring on Montserrat, to analyse the deformation data acquired by the local GPS network.
Using numerical modelling, they quantified the accumulation rate of magma below Montserrat, which is in line with the continuing inflation and pressurisation of the island. Other factors that might explain the deformation trend such as tectonic plate movement or crystallisation and pressurisation of an existing (but not growing) magma body were ruled out as major contributors to the deformation trend.
Using this model, they went backwards in time and analysed the eruptive history of Soufrière Hills since 1995, comparing volume changes in the magma reservoir with the amount of erupted material at the surface (Figure 1).
Despite the ongoing inflation, the magma volume in the reservoir that existed before the eruption started has not yet been reached. However, in the past, the volcano did not wait until the reservoir was refilled, but started the next eruptive phase sooner (Figure 2). Therefore, the ash venting in the beginning of 2012 might have been a “failed eruption” and the next eruptive phase is overdue.
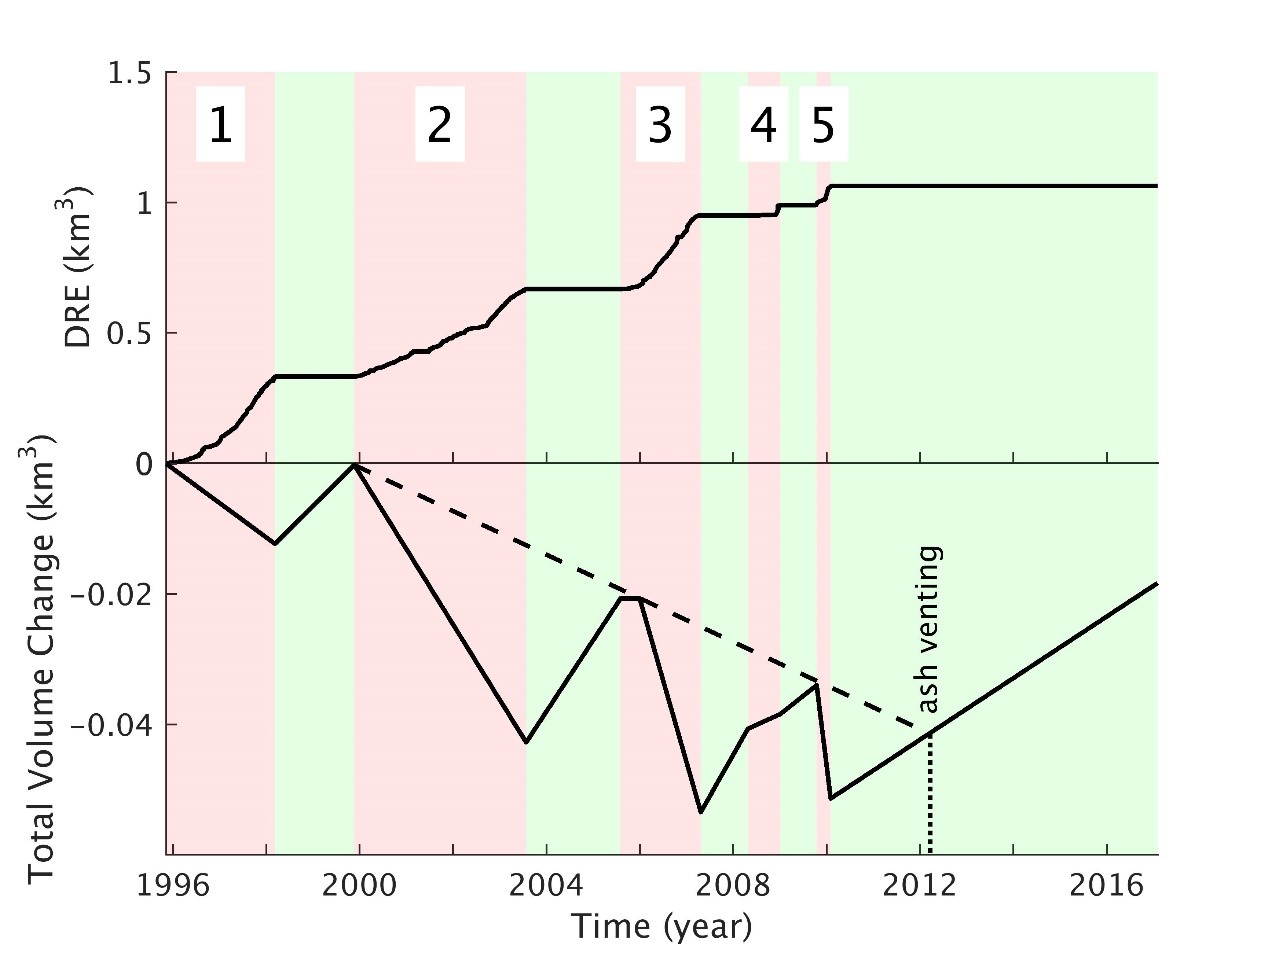
Figure 2: Eruption phases 1 – 5 are indicated in pink, Pauses in green. Top: cumulative erupted volume (adapted from Wadge et al., 2014). Bottom: change in total reservoir volume through time relative to the start of the eruption. Total source volume change assumes the best-fit source with a volume of 1.26 km3. The dashed line indicates the trend of eruption onsets for Phases 2, 3 and 5. The location of the March 2012 ash-venting is indicated
Further analysis of the change in magma eruption rates and comparison with the amount of actual erupted material will provide insights into the compressibility of magma at depth, and hence, changes of magma properties over time. Research outputs like this feed directly into the discussions of the Scientific Advisory Committee on Montserrat Volcano Activity, and are a crucial contribution by COMET to support decision making by the British and the Montserratian Governments.