
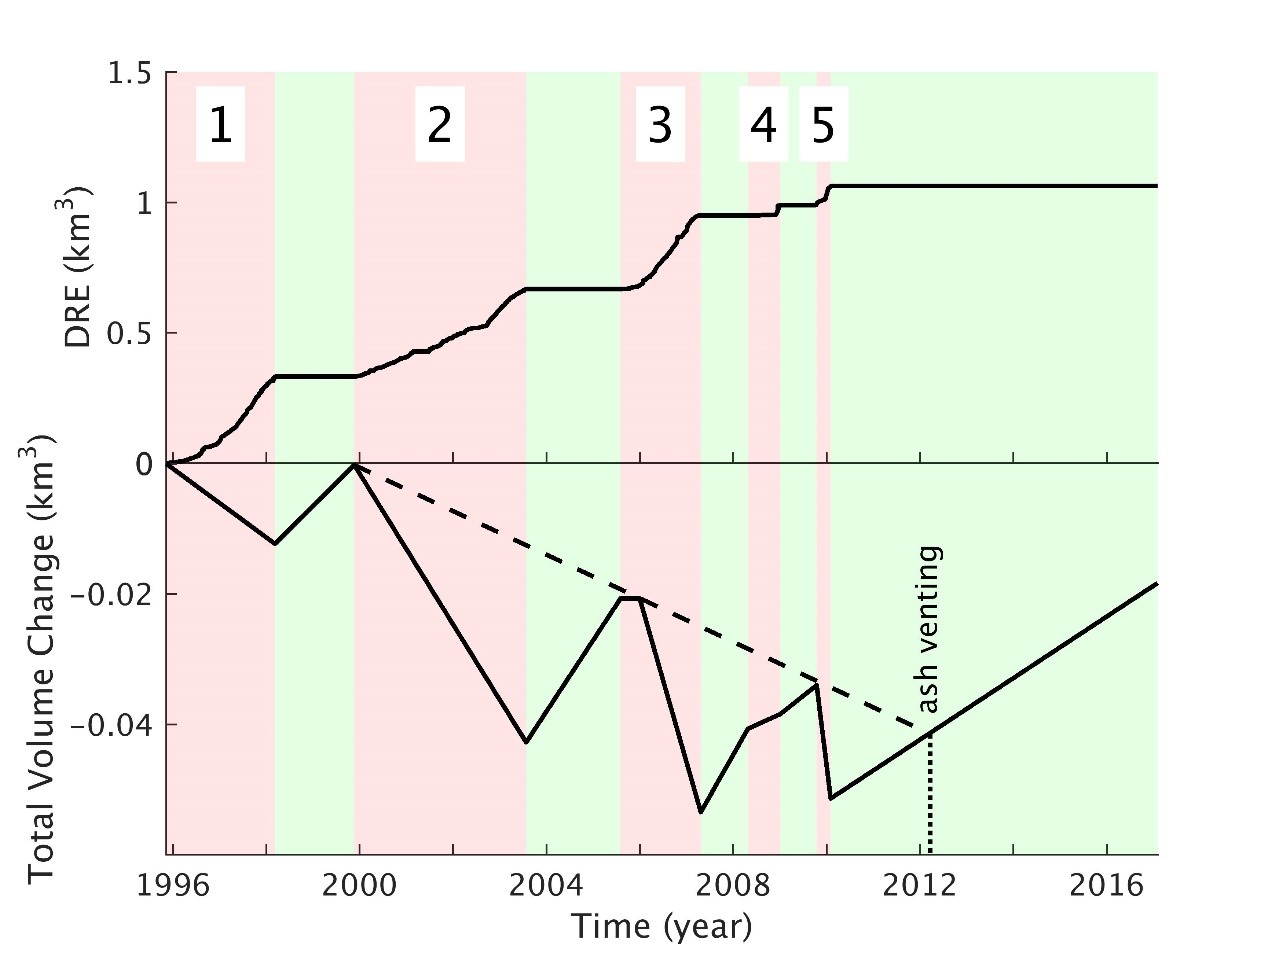
Figure 2: Eruption phases 1 – 5 are indicated in pink, Pauses in green. Top: cumulative erupted volume (adapted from Wadge et al., 2014). Bottom: change in total reservoir volume through time relative to the start of the eruption. Total source volume change assumes the best-fit source with a volume of 1.26 km3. The dashed line indicates the trend of eruption onsets for Phases 2, 3 and 5. The location of the March 2012 ash-venting is indicated