Intrusive activity at Cerro Azul Volcano, Galápagos Islands (Ecuador)

Intrusive activity at Cerro Azul Volcano, Galápagos Islands (Ecuador)

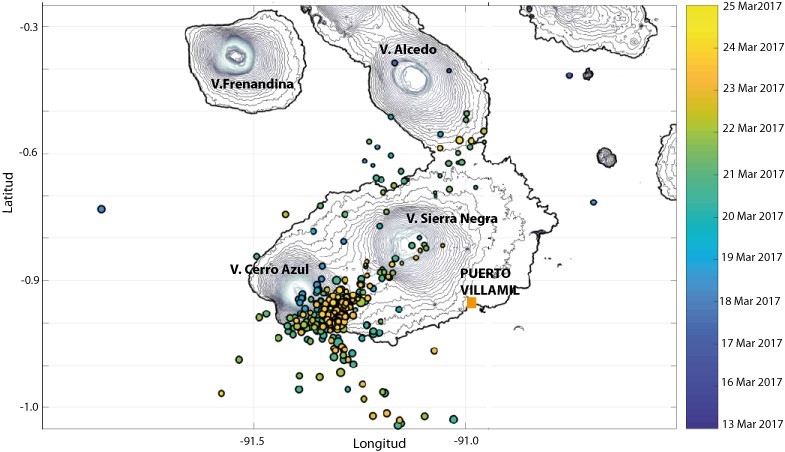
Cerro Azul is the southernmost active volcano on Isabela Island, Galápagos (Ecuador). On 18-19 March 2017, seismic activity increased on the SE flank of the volcano.

On the same day, the Instituto Geofisico Escuela Politécnica National (IGEPN), the organisation responsible for the monitoring of Ecuadorian volcanoes, issued a warning for a possible imminent eruption.

The recorded seismicity was composed of volcano tectonic (VT) earthquakes, consistent with processes of rock fracturing, with the majority of the events having magnitude ranging between 2.4 and 3.  There were also sporadic events with magnitude up to 3.6 (see the second activity update released by IGEPN on 24 March).

The Sentinel-1 satellite acquired synthetic aperture radar data on 7  and 8 of March, prior to the onset of the seismic activity, and on 19 and 20 March, once seismicity started to exceed background levels both in terms of number of earthquakes and of energy release.

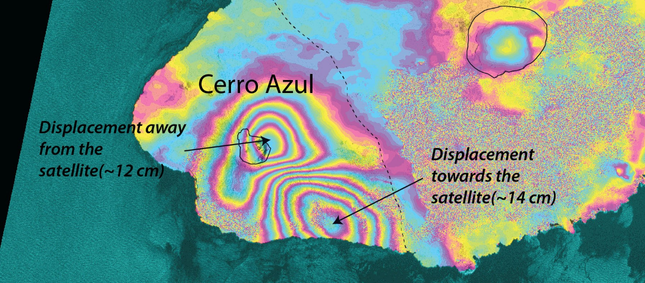
Applying SAR interferometric techniques (e.g. InSAR) showed significant deformation (up to 14 cm) in the region affected by the seismic swarm. More specifically, the InSAR data shows uplift at the southeastern flank of the volcano and contemporary subsidence centered at the summit of the volcano.

Sentinel-1 interferogram showing deformation caused by the magmatic intrusion as of 20 March 2017. Each color fringe corresponds to ~2.8 cm of displacement in the direction between the ground and the satellite.

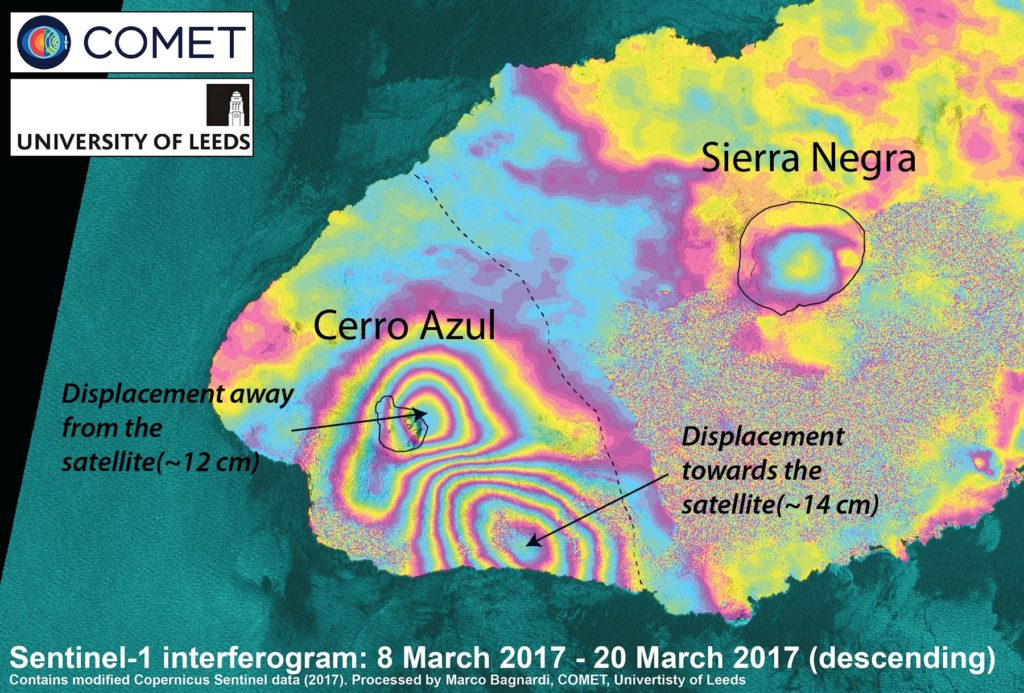
COMET researcher Marco Bagnardi, working with the IGEPN, carried out a preliminary analysis of the InSAR data and observed that the deformation (at least as of 20 March 2017) can be explained by the intrusion of a 20-40 million cubic meters sill at a depth of ~5 km beneath the surface of the volcano.

Modelling results from the inversion of InSAR data. The proposed model is composed of a horizontal sill intrusion at ~5 km depth (black rectangle) fed by a deflating source at ~6 km depth (black star).

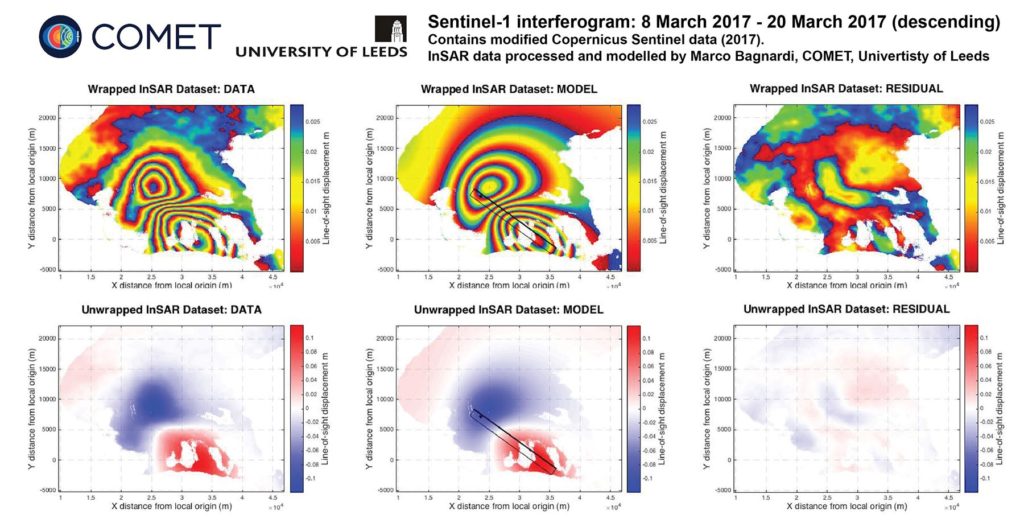
Such intrusion is likely to be fed by a 6 km deep reservoir, cantered beneath the summit of the volcano. The location of the intrusion well matches the location of the seismicity recorded by IGEPN.

Earthquake locations between 13 and 25 March 2017. Credit: IGEPN “Informe Especial Cerro Azul No. 2 – 2017”.

Marco Bagnardi said: “Within ten hours from receiving the warning from IGEPN, we were able to get hold of the most recent Sentinel-1 data for the area, process them to form differential interferograms, invert the data to infer the source of the observed deformation, and pass on the information to our Ecuadorian colleagues.”

The seismic activity seems to be continuing today.  IGEPN is currently proposing two possible scenarios for the evolution of this episode of volcanic unrest:

  • the intrusion could reach the surface and feed an effusive eruption in the coming days or weeks, as happened in 1998 and 2008; or
  • seismic activity and deformation could return to background level without the eruption of magma at the surface.

The next Sentinel-1 acquisitions will be on 1 and 2 April.  They will hopefully shed more light on the nature of the magmatic intrusion and on its evolution since 20 March.

Massive quake shifts perception of earthquake hazard models

Dramatic data from last year’s major earthquake in Kaikoura, New Zealand, will change the way scientists think about earthquake hazards in tectonic plate boundary zones.

The South Island earthquake was one of the most comprehensively recorded earthquakes in history.  Satellite images of the earthquake and its aftermath have enabled scientists to analyse the quake in an unprecedented level of detail.

COMET Director Tim Wright, study co-author, said: “We’ve never seen anything like the Kaikoura quake before, it was one of the most complex ever recorded.

“An earthquake commonly ruptures across a single fault line or faults that are closely grouped; Kaikoura ruptured at least 12 major faults. This challenges many assumptions about how individual faults control earthquake ruptures.”

Immediately following the start of Kaikoura’s earthquake in November, the Sentinel-1 and ALOS-2 satellites were tasked with gathering images and data.  COMET researchers at the University of Leeds used the data to provide a rapid analysis of what was happening during the quake.

They found that seismic readings of the earthquake were not giving accurate assessments of where the ruptures were occurring.

Professor Wright said: “Seismic readings are currently the fastest method of gathering earthquake data as they can quickly read shockwaves sent through the earth – but they paint a crude picture. The complexity of the Kaikoura earthquake caused seismologists to completely misinterpret the earthquake based on these seismic waves.

“Satellites such as the European Space Agency’s Sentinel-1 measure the way the ground deforms at very high resolution. The detail in the images showed us that ruptures took place across many separate faults.

“One of the aims of COMET is to expand satellite capability to provide rapid response earthquake data to ensure residents and rescue workers have access to fast and accurate information.”

The satellites provided pre- and post-earthquake images to measure the extent of land movement. Kaikaoura’s earthquake caused sections of earth to move up to 25 metres and created surface ruptures measuring 12 metres. This caused large scale landslides and triggered a tsunami.

Map of the South Island of New Zealand showing the ground deformation and location of the surface rupture from the November 2016 Kaikoura earthquake. The rainbow contours of ground motion are in 20 cm intervals whilst the red/blue colours show up to +/-6 m of motion near the fault. The sharp change in colour nearer the coast is where the fault has ruptured through to the surface.

In a study published today in Science, the team of researchers reports the full range of data analysed from Kaikaoura’s earthquake, including satellite imagery, field observation, GPS data and coastal uplift data.

See more details: Altmetric – Complex multifault rupture during the 2016 Mw 7.8 Kaikōura earthquake, New Zealand

The research will prompt reassessment of how many different faults can be involved in a single earthquake and could potentially feed into revaluations of seismic hazard models.

Lead researcher Dr Ian Hamling, a natural hazards geodesist from New Zealand research institute GNS Science, said: “There was growing evidence internationally that conventional seismic hazard models are too simple and restrictive.

“The message from Kaikoura is that earthquake science should be more open to a wider range of possibilities when rupture models are being developed. It underlines the importance of re-evaluating how rupture scenarios are defined for seismic hazard models.”

New Zealand’s complex network of faults are similar to those found in western United States, Japan and central Asia.

Leeds co-author and COMET Associate Dr John Elliott said: “While earthquakes like Kaikoura’s do not commonly occur, the data we’ve gathered from this event will expand our understanding of similar boundary zones around the world.

“Not only could the data help inform us for the future but it may change how we’ve interpreted ancient earthquakes. If an earthquake like Kaikoura’s took place thousands of years ago, current methods of paleo-seismology would possibly see it as a series of earthquakes over a long period of time, rather than as one large single quake.”

The full paper, ‘Complex multi-fault rupture during the 2016 M7.8 Kaikoura earthquake, New Zealand’ was published on 23 March in Science First Release.