Satellite Data Reveals Deformation On A Trans-Continental Scale

Satellite Data Reveals Deformation On A Trans-Continental Scale

Satellites show how the Earth’s largest earthquake belt is deforming at a trans-continental scale

A new study from COMET scientists combining satellite radar imagery with GPS measurements has produced the first high-resolution trans-continental map of ground deformation across the Alpine-Himalayan Belt, which is the most seismically active region on Earth.

The team, led by Professor John Elliott (COMET Scientist, University of Leeds), analysed more than 222,000 radar images from Sentinel-1, combined with Global Navigation Satellite System (GNSS) measurements from ground stations, to produce the first continuous and high-resolution map of ground motion across the Alpine-Himalayan Belt (AHB).

The AHB covers the massive span of land of more than 11,000 km where the African, Indian, and Arabian plates collide with Eurasia, building huge mountain chains like the Himalayas. It’s an area of high tectonic activity, with earthquakes here having killed more than 10,000 people since 1900, demonstrating how crucial understanding of the processes is.

A view of the himalayan mountains.

Despite its importance for understanding seismic hazard, detailed, continuous measurements of how the ground is moving across this enormous region have been out of reach until now. Capitalising on the new availability of remote-sensing data from satellite platforms, this study aimed to improve our knowledge of the deformation of the AHB region, which has historically lacked the dense GNSS coverage of Europe and America, and to create a better understanding of seismic hazards for the future.

A map of how the continents move

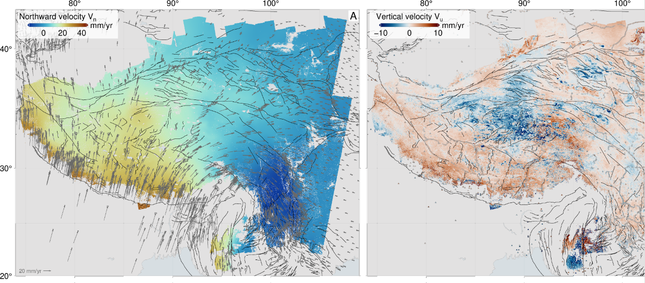
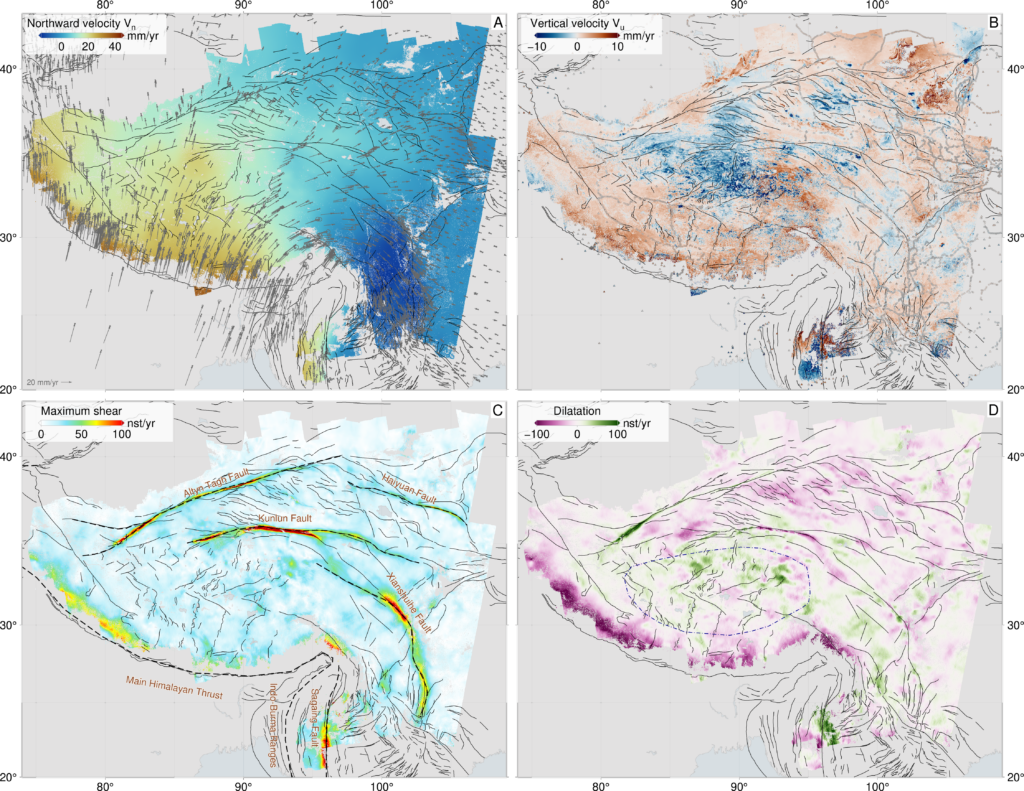
The result is the first 3D velocity field of the entire Alpine-Himalayan Belt. From it, the team derived horizontal strain rates, a measure of how rock is being stretched or compressed, yielding near-continuous information about deformation across the full extent of the belt for the first time.

Graphical abstract showing velocities across the Alpine Himalayan Belt

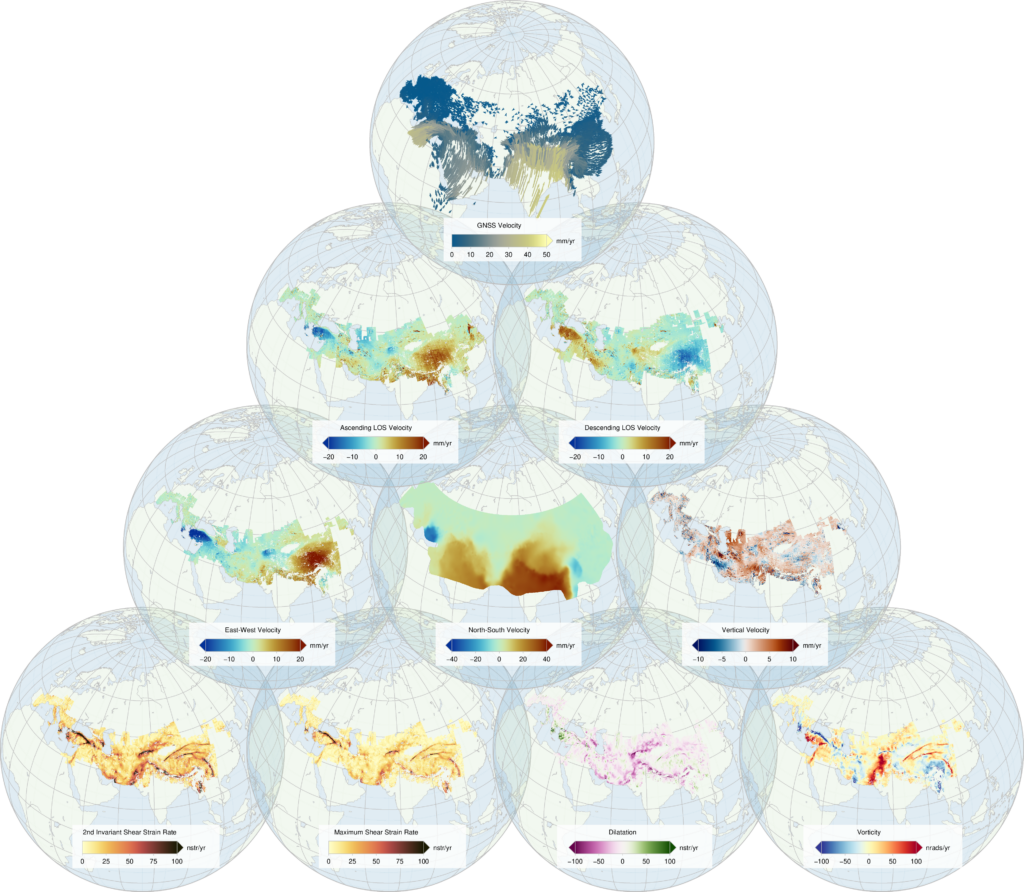
The satellite radar data revealed complex deformation patterns, with strain not only linked to the major strike-slip faults (Anatolia and the Tibetan Plateau) and major convergence zones (Himalayas and Pamirs), but also distributed across the wide regions between these features. This is key for highlighting how widely the deformation is spread over the crust.

These results also distinguished how horizontal movements were mainly connected to the plate convergence activity, whilst vertical ground motion could often be linked to human activity, such as the overexploitation of groundwater extraction (leading to subsidence) in Türkiye, Iran, and the North China Plain. Permafrost changes at high elevations also created substantial subsidence.

Spanning across eight years of monitoring activity (2016 to 2024), and an area of more than twenty million square kilometres (spanning from SW Europe to Eastern China) such a comprehensive record has not been produced before and is an enormous achievement by the team.

Why this matters for earthquake hazard

Understanding where strain is building up, and how fast, is essential for assessing where the next major earthquake is most likely to happen. Previous efforts to map deformation at this scale relied primarily on sparse networks of GNSS ground stations, which are unevenly distributed across the belt and cannot capture localised deformation features between stations.

This new approach provides far greater spatial detail, revealing fault-by-fault patterns of strain accumulation that were previously invisible at continental scale.

The velocity and strain rate datasets produced in this study are freely available and are intended to serve as foundational resources for researchers working on earthquake hazard assessment, geodynamics, and continental deformation worldwide.

A screenshot of the interactive viewer (linked at bottom of article) showing the major fault systems across the region.

Open data for the global research community

The massive open access dataset created by this study is an incredible new resource for studying the region, building on and clarifying 171 previous studies to produce the best picture yet of how the crust is moving across the whole AHB. Recently launched missions will also help to better measure strain in areas with denser vegetation.

Lead author, Professor John Elliott of the University of Leeds, said of the new paper, “This ability to view the huge collision zone of these large, shifting tectonic plates from space has enabled us to get an important perspective on the build-up of pressure that ultimately leads to earthquakes and the growth of mountains. The openness of the data from the European Space Agency has enabled us to achieve this, and we make our results freely available in return, for others to build on.”

The study was made possible by ESA’s open data policy for the Sentinel-1 mission, which allows researchers free access to one of the world’s most comprehensive archives of radar Earth observation data. InSAR processing was carried out using the LiCSAR system developed at Leeds, with time series analysis performed using the LiCSBAS software. All datasets have been archived and are publicly available via the CEDA Archive and Zenodo.

Alongside NERC COMET, the research was supported by the NERC Looking into the Continents from Space (LiCS) grant, the ESA Copernicus Programme, and the European Plate Observation System (EPOS).

Find Out More

You can read the full article here:

Elliott, J.R. et al. (2026) Deformation, strains, and velocities for the Alpine Himalayan Belt from trans-continental Sentinel-1 InSAR & GNSS. Remote Sensing of Environment. 388: 115320

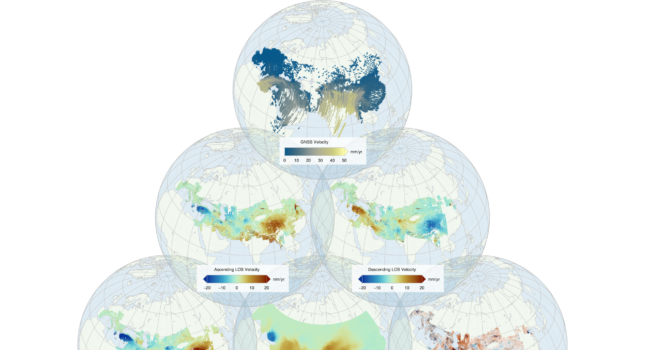
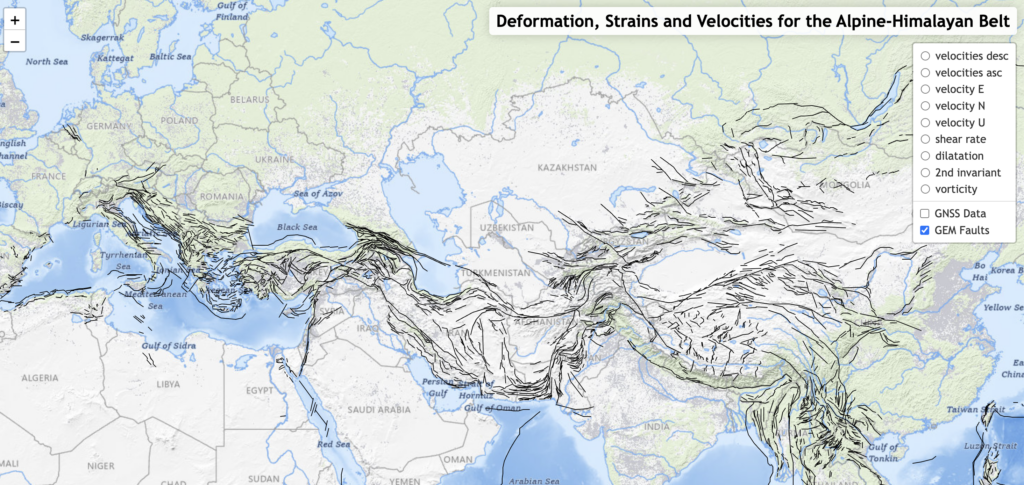
You can also view the velocities in detail with this interactive viewer:

https://gws-access.jasmin.ac.uk/public/nceo_geohazards/LiCSAR_products/velocities/map_ahb.html

New map redraws our understanding of how continents deform

A high-resolution map of the Tibetan Plateau reveals that major faults are far weaker than expected, pointing to slow, continent-wide flow rather than rigid block motion. 

Scientists have created the most detailed map ever produced of how the largest region of active continental movement on Earth, the Tibetan Plateau, is stretching, squeezing, and shifting in unexpected ways.  

The results, published in Science, overturn longstanding ideas about how continents deform, and reveal that the interior of Asia is best explained as a flowing material, guided by weak faults.  

This analysis draws on tens of thousands of satellite images and one of the most extensive geodetic datasets ever assembled. Using more than 44,000 radar images from the European Space Agency’s Sentinel-1 satellite, over 340,000 maps showing ground movement (interferograms), and 14,000+ Global Navigation Satellite System (GNSS) measurements, the research team produced an unprecedented, millimetre per year scale velocity map of the entire plateau. This is the highest resolution view to date of how the collision between India and Eurasia, one of the most powerful tectonic events on the planet, is reshaping Asia. 

This is the clearest picture yet of how a continent deforms under extraordinary forces,” said lead author Tim Wright (University of Leeds / COMET). “By mapping motion across the whole region in incredible detail, we can finally see how the Tibetan Plateau is actually moving, and the story it tells is very different from what the old models predicted.” 

Weak faults, flowing continents 

Conventional models often treat Tibet as a mosaic of strong, rigid blocks separated by major faults that slip horizontally past each other. But when the team compared their high-resolution movement map with dynamic models of continental flow, they found a striking mismatch: the observations can only be explained if the major fault systems, including the Kunlun Fault system, which failed in very large earthquakes in 1997 and 2001, are weak, offering little resistance to deformation. 

“The data show that continents don’t behave like a mosaic of stiff plates. They flow, but their flow is enabled by major faults, which act as weak zones,” said co-author Greg Houseman (China University of Geosciences Beijing and University of Leeds). “This helps explain why the extension in southern and central Tibetan plateau is so widespread.” 

Why central Tibet is stretching apart 

One of the most surprising findings is a clear explanation for Tibet’s widespread east–west extension, particularly in the plateau’s interior. The new models show that to match the observations the Kunlun Fault must be extremely weak, allowing the northern edge of central Tibet to slide freely relative to the region north of it. This weak boundary enables the plateau interior to collapse and stretch east–west, releasing gravitational potential energy accumulated by the immense thickness of the crust. 

“The weakness of the Kunlun Fault is the key that unlocks what’s happening in central Tibet,” said coauthor Jin Fang (University of Leeds / COMET). “It allows the interior of the plateau to essentially flow eastwards, helping to explain the region’s widespread extension, something that has puzzled geologists for decades.” 

A new framework for understanding continental interiors 

The study’s findings reshape scientific understanding of how continental interiors respond to largescale tectonic forces. By demonstrating that weak faults and viscous-like flow dominate deformation across the Tibetan Plateau, the work provides a more physically realistic foundation for future research on mountain building, continental dynamics, and long-term seismic hazard across Asia. 

“This is a fundamentally new way of looking at how continents work,” said Wright. “And with next generation satellites and global coverage, this approach could soon give us similarly detailed maps for deforming regions all around the world.” 

Around three quarters of the world’s deadliest earthquakes occur in continental interiors. The new tools and maps produced by the research team are already being used to improve seismic hazard models used to help countries and communities prepare for earthquakes. 

This research, led by Tim Wright (University of Leeds/COMET), is a collaboration between the UK Centre for Observation and Modelling of Earthquakes, Volcanoes and Tectonics (COMET) across the universities of Leeds, Edinburgh, Exeter, and Oxford, and the China University of Geosciences (Beijing, China), Monash University (Australia), GNS Science (New Zealand), Columbia University (New York, USA) and South China Agricultural University (Guangzhou, China). 

The research was funded primarily by the UK Natural Environment Research Council (NERC), with additional support from the Royal Society and the National Natural Science Foundation of China. 

The UK Centre for Observation and Modelling of Earthquakes, Volcanoes and Tectonics (COMET) is a trusted centre of excellence in volcanic and earthquake science, combining expertise in observations and hazard modelling to deliver accessible data and advice for global risk reduction and resilience. COMET brings together world-leading scientists across 16 UK universities, the British Geological Survey (BGS), and external partners.