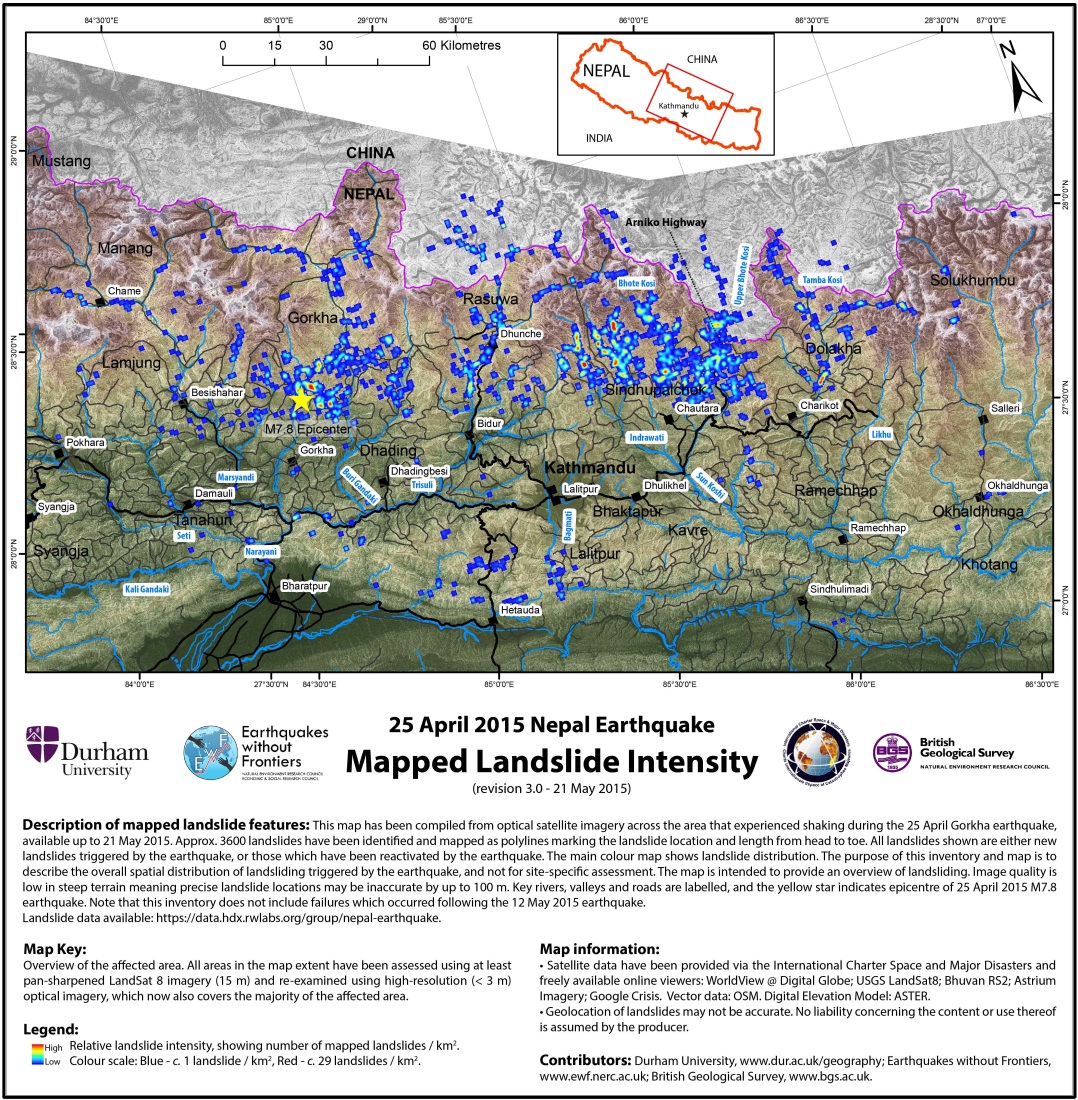
Figure 2: Landslide map. Colour scale shows landslide intensity, with blue ~ 1 landslide/km2 and red ~29 landslides/km2. ( http://ewf.nerc.ac.uk/2015/05/28/nepal-updated-28-may-landslide-inventory-following-25-april-nepal-earthquake/) Image credit: University of Durham, EwF, BGS. Satellite data have been provided via the International Charter for Space and Major Disasters and freely available online viewers: WorldView @ Digital Globe; USGS LandSat8; Bhuvan RS2; Astrium Imagery; Google Crisis. Vector data: OSM. Digital Elevation Model: ASTER