This article is based on a 2016 Nature Communications paper by John Elliott, Richard Walters and Tim Wright.
Satellite remote sensing techniques have advanced rapidly over the last 20 years, but until now, data quality, quantity and access has often been limited, whilst systematic acquisitions from dedicated satellites have also been lacking.
However, as population growth continues in areas of high seismic hazard, there is an increasing need to fully utilise the near-global onshore reach of Earth Observation (EO) techniques to investigate earthquakes and active tectonics.
A new generation of satellite missions, alongside technical advances, is now helping EO to reach its full potential, complementing existing work in seismology, GNSS and field measurements. In particular, Sentinel-1, with its open data policy, is poised to become the main tool for measuring small-scale crustal deformation over large areas for the next two decades, helping us to understand our dynamic planet.
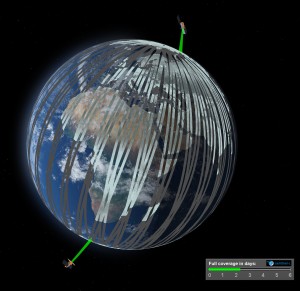
Sentinel 1A, launched in April 2014 and joined in 2016 by the identical 1B. This two satellite constellation offers the chance of 6 day revisit periods, allowing for a greater number of observations and more rapid detection of deformation
Recent years have seen a step change in the consistency and global coverage of Earth observing systems, along with a shift towards free and open data access. At the same time, there have been significant advances in data processing, a huge increase in the number of radar satellites, with the ability to observe the Earth even in cloudy conditions (particularly important in mountainous regions) and a shift to constellations rather than single satellites, reducing revisit times (to 6 days in the case of Sentinel-1).
These systems are just beginning to be systematically and routinely exploited to respond to both specific earthquakes and longer-term hazard, but together they provide a great opportunity to advance our understanding of active tectonics and earthquakes, and therefore our ability to respond to natural disasters.
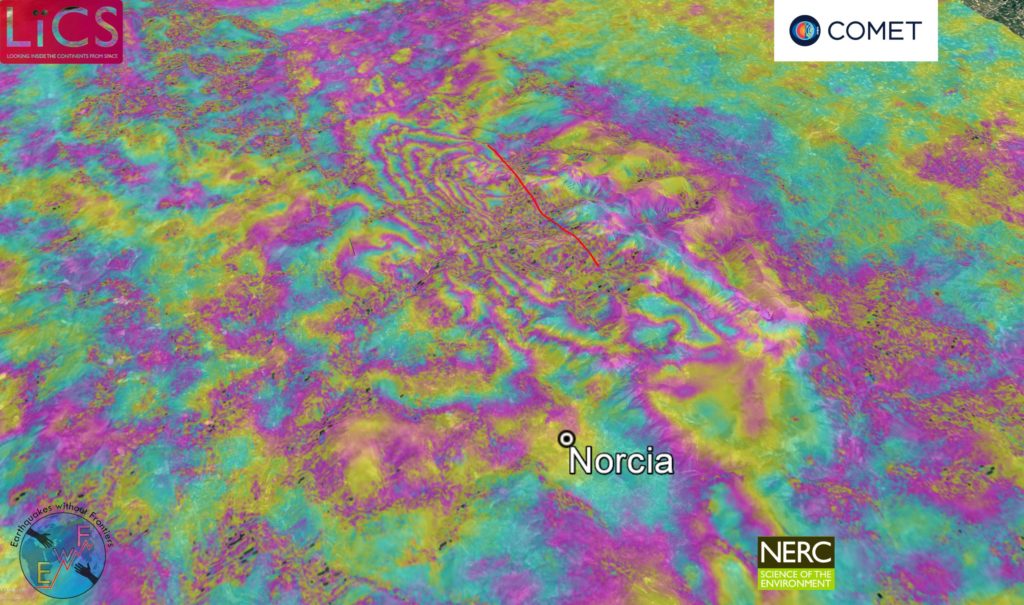
Sentinel-1 in particular has made systematic, large scale (100–1,000 km) EO possible following disasters – in fact, the scientific response to major earthquakes now begins with the analysis of satellite imagery: since 1992, Synthetic Aperture Radar Interferometry, or InSAR, has been used to study more than 100 (often continental) earthquakes, providing remote measurements of ground displacement at very high-spatial resolution.
Imagery collected in the aftermath of earthquakes has also been used to map landslides and tsunami inundations, assess building damage, and update seismic earthquake source models to improve estimates of ground shaking.
As InSAR images displacement of the ground surface, it can determine the particular fault that ruptured at depth. This is not always obvious from ground observations, as many major ruptures do not reach the surface. It can also help detangle the complex segmentation pattern of faults that we often observe for many of these major events.
Determining fault slip using InSAR can establish which portions of the fault failed. From this, we can calculate stress transfer onto surrounding faults, identifying the parts of the fault system that have been brought closer to failure. InSAR can also be used to map small displacements, allowing us to detect previously unmapped faults that have been triggered by the earthquake.
Satellite EO can also play a crucial role in understanding large-scale deformation. Past estimates of seismic hazard have often been based on the earthquake record, with historical and instrumental data used to forecast the probability of future earthquakes. However, in most continental active tectonic regions, the time between earthquakes is longer than the historical record. In addition, in areas with long recurrence intervals, the next large earthquake is unlikely to be in the same location as the previous one.
Instead, with InSAR, we can measure interseismic strain in many of these regions, avoiding the reliance on incomplete records of seismicity, and at the same time characterising the physical cause of earthquakes. InSAR was first used to measure interseismic deformation for the North Anatolian Fault in Eastern Turkey, and has since been used on faults worldwide.
Although there are limitations on InSAR’s ability to measure these small ground movements (often due to nuisance signals arising from changes in atmospheric conditions), the development of noise correction and time-series techniques have helped to reduce uncertainties. We can now estimate interseismic strain rate at relatively high-resolution and with a degree of accuracy that offers the potential to investigate a large number of major faults worldwide as well as slower or distributed deforming areas.
Translating this information into forecasts of seismic hazard is not straightforward, but strain rates based on GNSS have already been used to create a global forecast of seismicity, and InSAR will be used to improve these forecasts in regions where GNSS measurements are sparse.
On longer timescales, EO data can contribute to hazard estimates by informing the development of physics-based models of fault behaviour. The intervals between most earthquakes are much longer than the period for which we have good observations, but we can cleverly combine data to build models that predict how deformation varies throughout the entire earthquake cycle.
Presuming that all faults behave in a similar way, we can use observations from different faults, at different points in the earthquake cycle, as a proxy for observations through time of a common process. There are a handful of locations across the planet where we have good geodetic observations before and after earthquakes, ranging from Turkey to Alaska, California and Tibet.
Interseismic and postseismic strain rates for four strike-slip faults where data are available both before and after a major earthquake
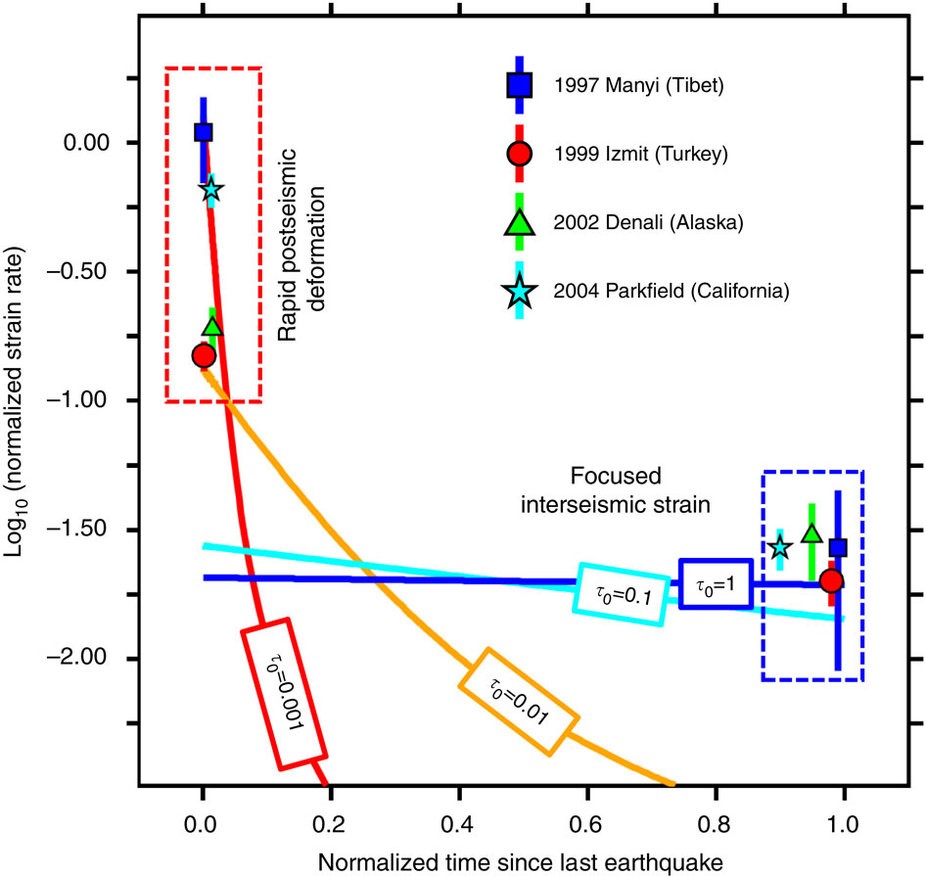
In each case, strain rates immediately after the last earthquake are high (red box), but they do not decay away completely by the end of the cycle- there is a remarkably consistent pattern of interseismic strain late in the earthquake cycle (blue box).
As a result, any successful model of the earthquake deformation cycle must be able to reproduce both interseismic strain and postseismic deformation. This has not always been easy in the past, for example from simple two-layer models of the Earth’s lithosphere or from models based on rock mechanics. Employing larger quantities and a better quality of EO data will help us to refine these models for an increasing number of earthquake faults.
On an even broader scale, satellite data is now allowing us to assess the mechanics of continental deformation. We know that the continents do not deform as large rigid plates like the oceans, but up to now there have been differing views on how this happens.
In one, the continents act like a viscous fluid, with faults reflecting the deformation of a deeper, controlling layer. In the other, the continents are seen as a collection of rigid blocks, each behaving like an independent plate.
Resolving this is important for earthquake hazard assessment–we need to understand the degree to which deformation and earthquakes are focused on major faults, as opposed to being distributed throughout the continents. Long time-series of surface deformation over regional scales from EO will enable us to assess this.
Another question that EO can help to answer is how elastic the deformation in the upper crust actually is in reality. Models tend to assume that the crust behaves elastically between earthquakes, yet geological structures often show plastic, non-reversible deformation.
Combined with field observations, EO can help us to assess to what extent surface deformation reflects elastic strain on faults that will eventually be released in earthquakes, or plastic deformation that builds geological structures.
Ultimately, satellite missions such as Sentinel-1 are improving our understanding of the entire earthquake cycle, helping us to determine the seismic potential of faults as well as mapping secondary earthquake-triggered hazards such as landsliding and building collapse.
In particular, the coming decade will see a dramatic improvement in our ability to observe longer-term and time-varying phenomena such as slow slip events. By combining these satellite observations with measurements from other, more established techniques, we will be able to develop new theories of active tectonics and earthquakes that improve our ability to live safely on this hazardous planet.
Reference
Elliott, J. R., Walters, R.J., and Wright, T.J. (2016) The role of space-based observation in understanding and responding to active tectonics and earthquakes, Nature Communications, doi: 10.1038/ncomms13844