The Executive Committees of WInSAR and COMET, and the scientific and organising committee of MDIS have released an open statement on the use of terminology in InSAR. Read the statement here.
Synthetic Aperture Radar Interferometry (InSAR) relies on radar satellites that return to the same area every few days, sending radar waves down to the ground surface and measuring the energy reflected back.
InSAR uses two or more satellite radar images acquired over the same area to map topography and detect surface changes. Small changes on the ground cause changes in the radar signal phase and lead to the rainbow-coloured fringes of an ‘interferogram’.
This ESA video is based on an interferogram generated with two radar images captured by Sentinel-1A in ‘interferometric wide-swath’ mode on 11 and 23 August 2014. It mainly shows topography around the northern coast of Norway. It demonstrates how useful the technique can be in mapping the shape of the land and monitoring ground movement.
By creating images from the data (interferograms) and analysing the patterns, we can measure differences in the time it takes the waves to make the round trip from the satellite to the Earth and back.
If part of the ground has moved further away from the satellite, perhaps because of an earthquake or volcanic eruption, the waves take slightly longer to return to the satellite. We can measure these differences in every pixel of the radar image to give us a map of how the ground has moved to within a few millimetres.
InSAR can also help us to understand where and when future disasters might happen. For example, before volcanoes erupt, magma often rises into a shallow reservoir beneath the volcano surface, causing it to lift up. If we detect magma movement, we can alert local decision makers and scientists to the potential hazard.
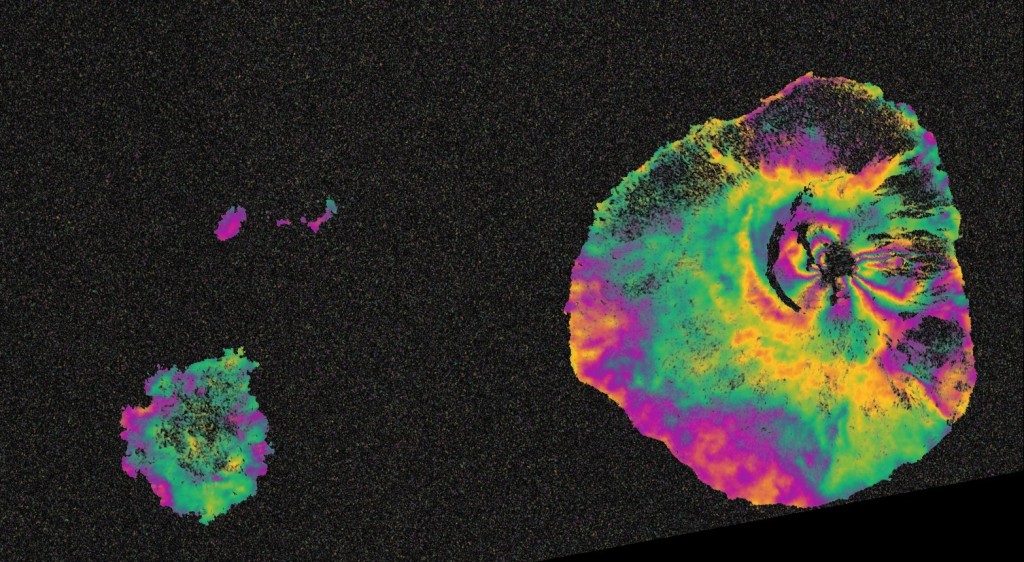
For example, the Pico do Fogo volcano on Cape Verde’s Fogo island erupted on 23 November 2014 and showed continuing volcanic activity in the days following. By processing two Sentinel-1A radar images, which were acquired on 3 November and 27 November 2014, this interferogram was generated.

Deformation on the ground causes phase changes in radar signals that appear as the rainbow-coloured patterns. Results like these are being used by Earth scientists to help them map the volcano’s subsurface magmatic system, modelling the volcanic eruption mechanics, and assist the relief efforts on the ground.
Meanwhile, although predicting earthquakes is near-impossible, the ground surface around faults slowly changes in response to tectonic forces. We can also use InSAR to measure how the surface is changing, and to assess earthquake risk.
InSAR is particularly important in remote areas and developing countries because it does not rely on having expensive instruments on the ground. Even in places like California and Japan where there are extensive instrument networks, no other technique can give us measurements with InSAR’s level of detail, covering such large areas.
We can also use the radar to identify areas that have been damaged, providing vital information for emergency response teams.
