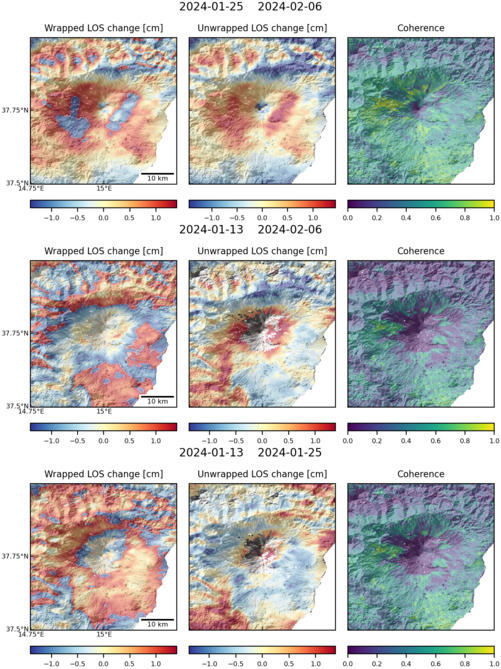
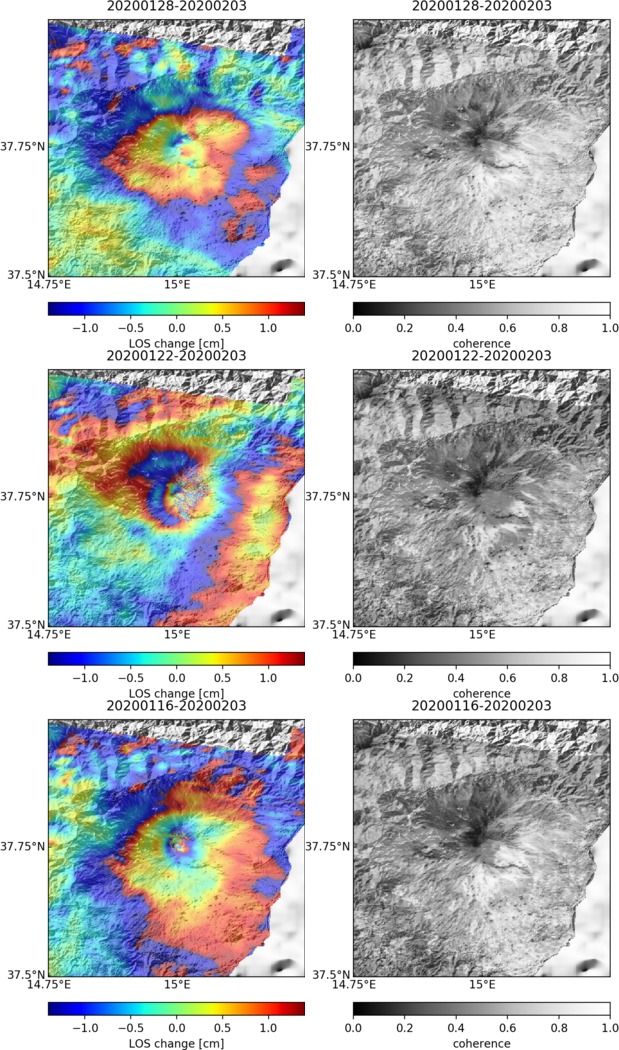
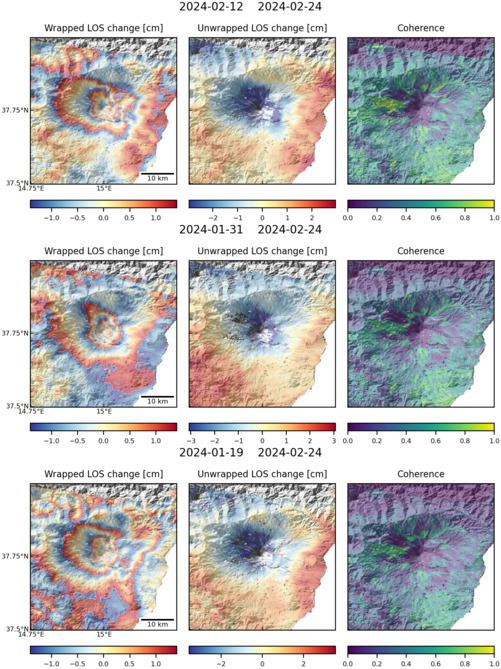
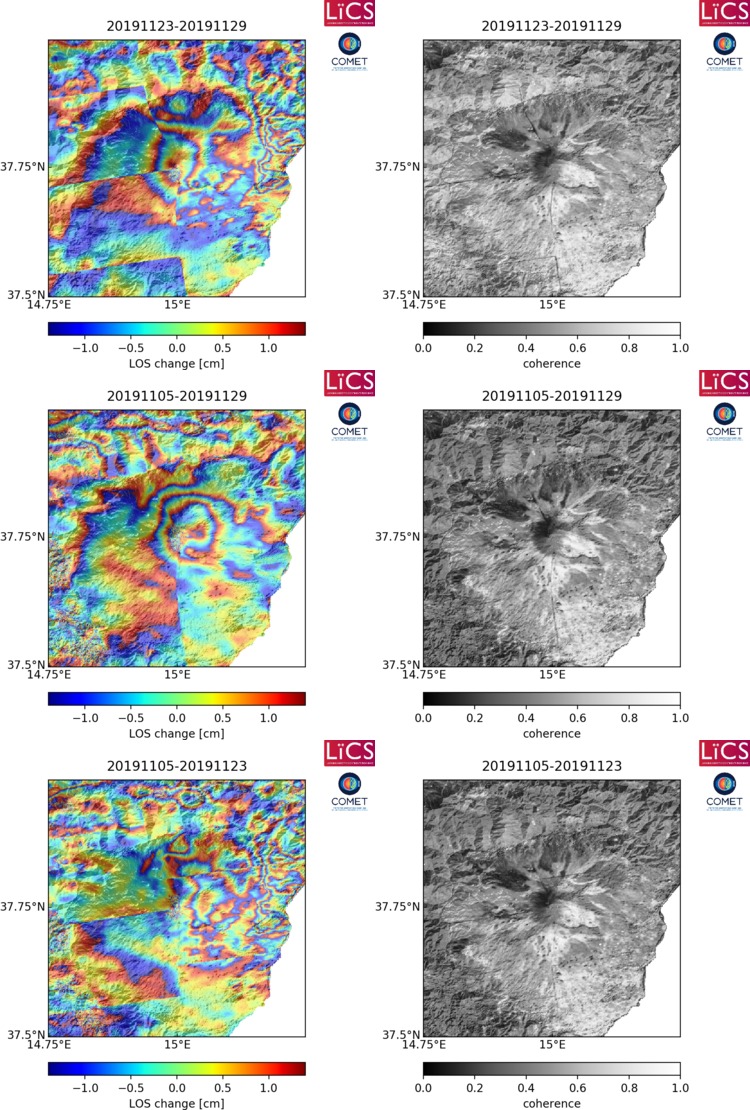
| Characteristics of deformation: | Mount Etna has one of the world’s longest documented records of historical volcanism, dating back to 1500 BCE.
Since 1982 to December 1991 geodetic measurements showed a dilatation trend measured by geodetic measurements (Bonaccorso and Davis, 2004).
The December 1991–March 1993 lateral eruption, which represented the most important lateral eruption in the last three centuries both in terms of duration (472 days) and volume of erupted lava (about 235 × 106 m3), was accompanied by an evident deflation (Bonaccorso, 1996 and Puglisi et al., 2001) that indicated a depressurizing intermediate storage zone ca. 3 km below sea level (bsl) (Bonaccorso, 1996).
Bonaccorso et al., (2011): Between 1993 – 2000, Etna’s activity was characterised by a recharging phase. During this period, the monitoring geophysical networks provided a multi-faceted reference data set. “The seismicity pattern indicated a radial compression around an axial intrusion consistent with a pressurization at a depth of 6 to 15 km, which triggered most of the seismicity (Patanè et al., 2003 and Allard et al., 2006). […] All geodetic measurements (EDM, GPS and InSar data) highlighted an overall continuous horizontal expansion of the volcano edifice. In spite of this nearly continuous expansion, the vertical pattern showed an overall uplift during 1993–1997 followed by lowering that affected mainly the south-eastern flank during 1997–2000. The 1993–1997 period represented a net inflation of the volcano edifice and the deformation pattern pointed to a pressure source located at about 4 km bsl interpreted as an intermediate recharging magma storage (Bonaccorso et al., 2005)”.
During the recharge phase, Bonaccorso et al. (2011) present more detailed analysis of deformation and show through joint analysis of ground deformation and gravity data that there were two clear deformation phases spanning 1993–1997 and 1997–2000, respectively. “The first phase was characterized by magma storage and accumulation at an intermediate depth (2–6 km below sea level).” In contrast, “during the second phase, the magma started to rise and intrude at shallower levels favoring the movement of the unstable eastern flank, which accelerated its sliding toward the East”.
On 28 December 2014, eruptive activity resumed at Mount Etna. Unlike all previous summit activity, this eruption produced clear deformation at the summit of the volcano. GPS displacements and Sentinel-1A ascending interferograms were calculated by Bonforte & Guglielmino (2015). Results show shallow NE-SW intrusion just beneath the New Southeast Crater and a component of gravitational failure of the lava flow field (Bonforte & Guglielmino, 2015).
|
|---|
| Bonaccorso, A., Bonforte, A., Currenti, G., Del Negro, C., Di Stefano, A., & Greco, F. (2011). Magma storage, eruptive activity and flank instability: inferences from ground deformation and gravity changes during the 1993–2000 recharging of Mt. Etna volcano. Journal of Volcanology and Geothermal Research, 200(3), 245-254. |


