Researchers from the University of Bristol’s COMET group shared new results on volcanic processes and monitoring at EGU 2026 in Vienna.
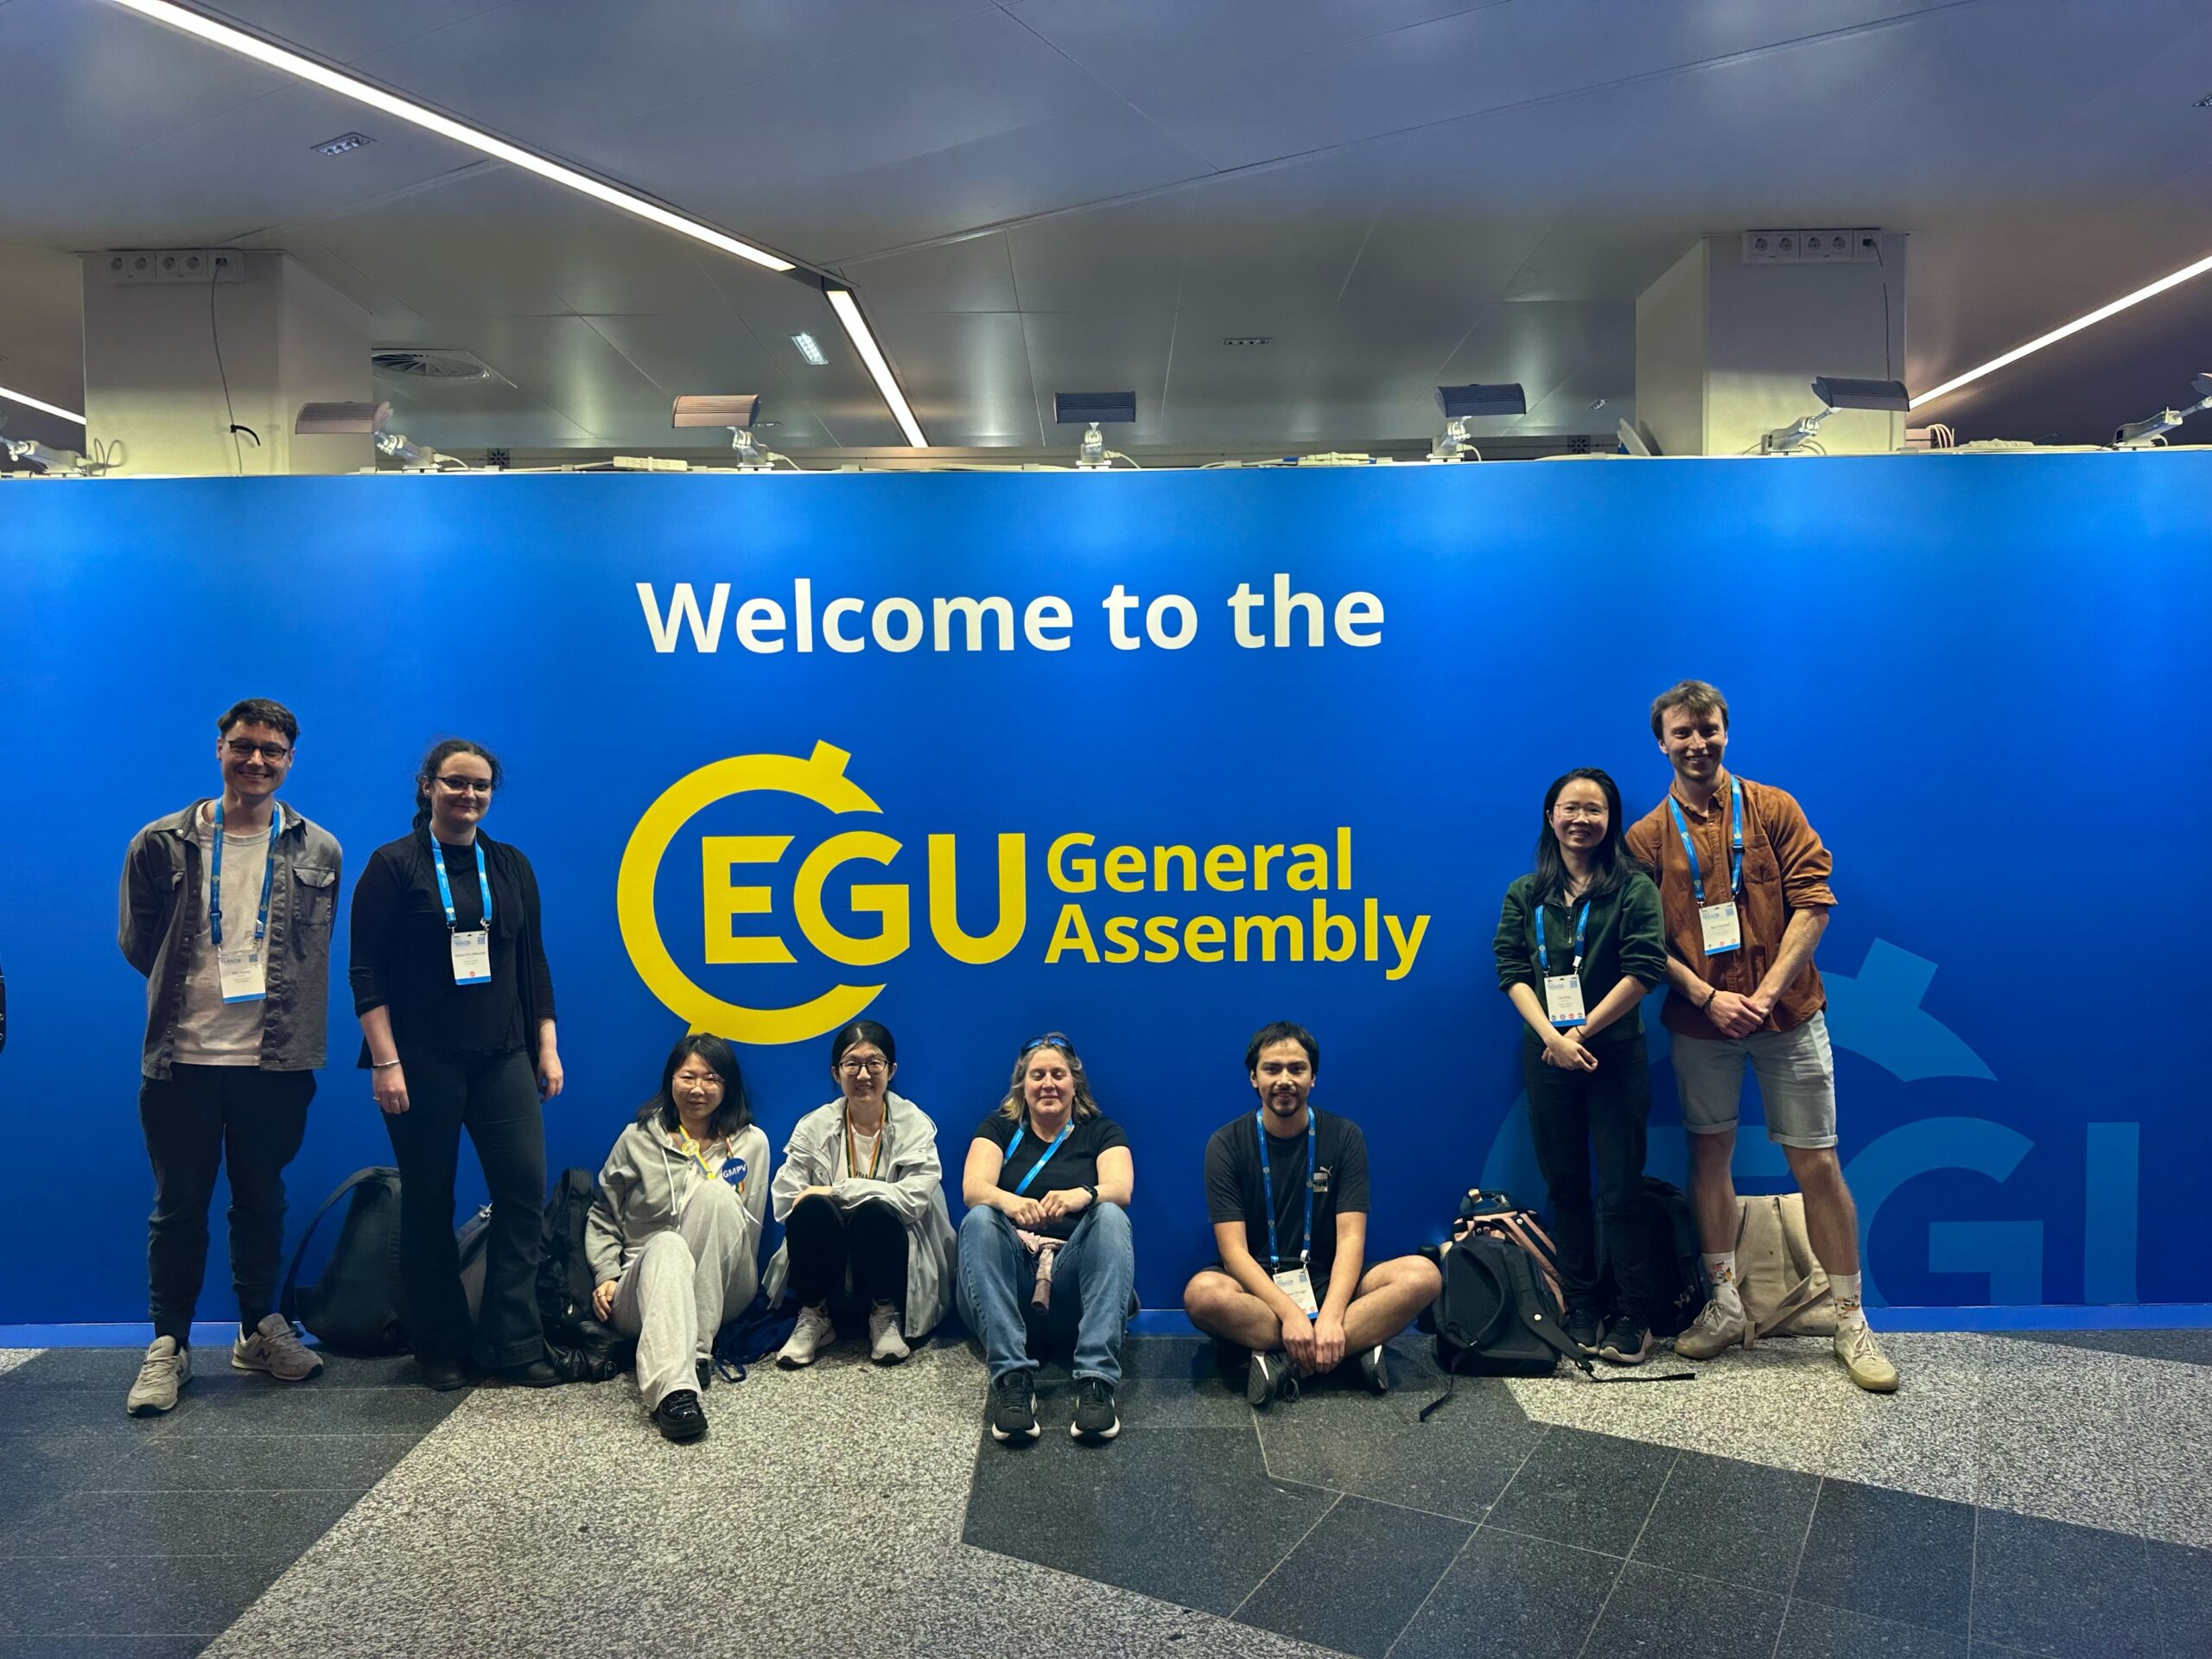
From May 3–8, members of the COMET group at the University of Bristol, led by Prof. Juliet Biggs (COMET co-director), attended the European Geosciences Union (EGU) General Assembly 2026 in Vienna, Austria. EGU is one of the largest geoscience conferences in the world, bringing together researchers across Earth, planetary, and environmental sciences. This year, our group contributed a wide range of talks, posters, and PICO presentations spanning volcanic deformation, dike intrusion processes, earthquake swarms, geodetic methods, remote sensing, and science communication.

It was a busy and exciting week, with presentations spread across many sessions and opportunities to discuss new research with collaborators and colleagues from around the world.
Monday: Modelling and Discussion across Disciplines
The week started with Prof. Juliet Biggs co-chairing the session GMPV10.12 Volcanic processes: tectonics, deformation, geodesy, unrest. The group enjoyed a fantastic series of talks throughout the session and had the opportunity to catch up with colleagues and collaborators from around the world.
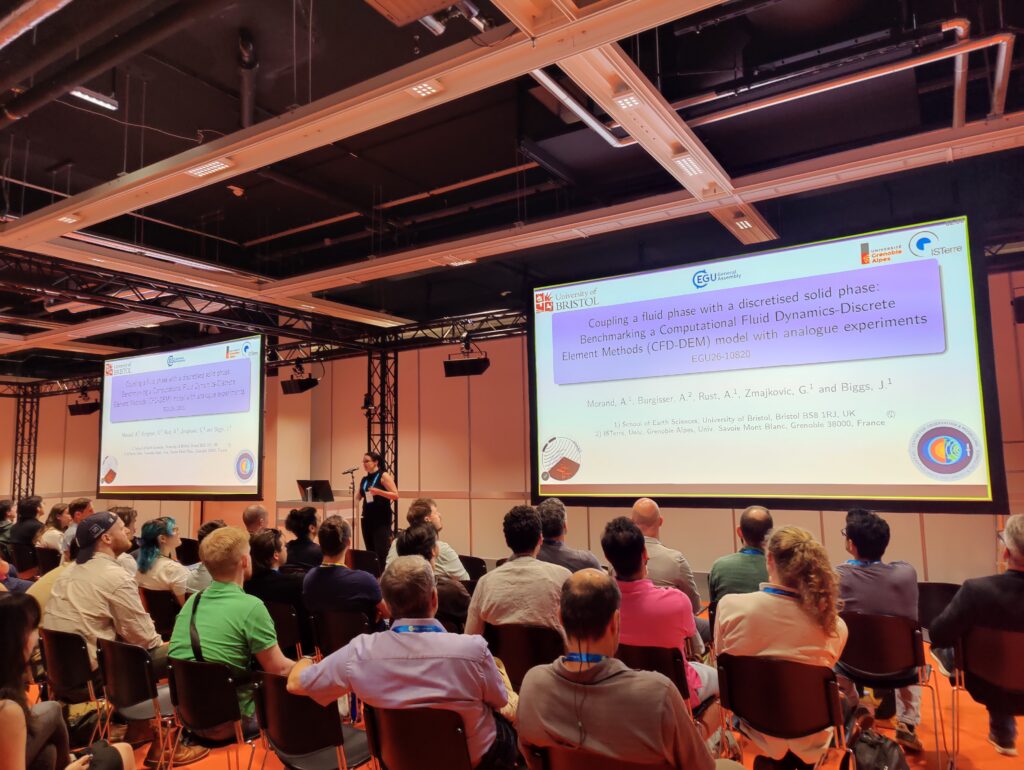
In the afternoon, Alexandra Morand presented her work during the PICO session GMPV12.1 Advances in computational modelling, data analysis, and visualisation. Her work, titled Coupling a fluid phase with a discretised solid phase: Benchmarking a Computational Fluid Dynamics–Discrete Element Methods (CFD-DEM) model with analogue experiments, explored a new numerical modelling framework that couples fluid flow with elastic and brittle deformation of surrounding rocks.
Tuesday: Seismicity, Deformation, and Magma Transport in the Rift
Tuesday was one of the busiest days of the week, with multiple group members presenting across different sessions spanning seismology, rifting, and remote sensing.
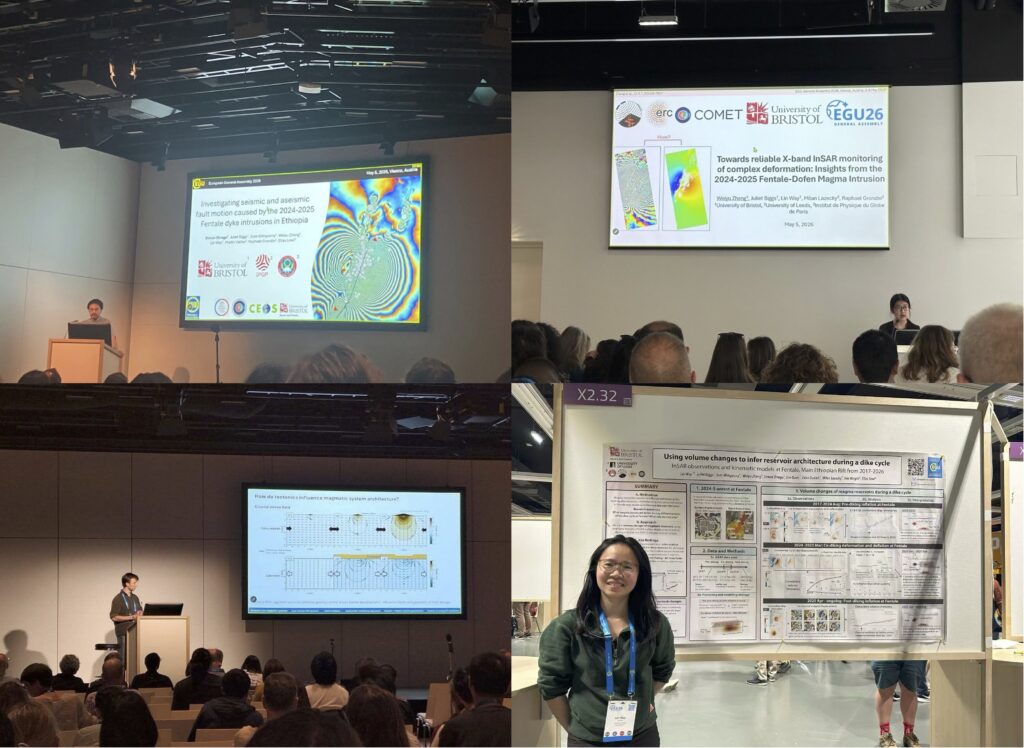
The day started early with Simon Orrego presenting in TS1.8 Seismic and aseismic fault deformation. His talk, Investigating seismic and aseismic fault motion caused by the 2024–2025 Fentale dyke intrusions in Ethiopia, provides new constraints on fault mechanics and the interaction with magmatic processes in rifting environments.
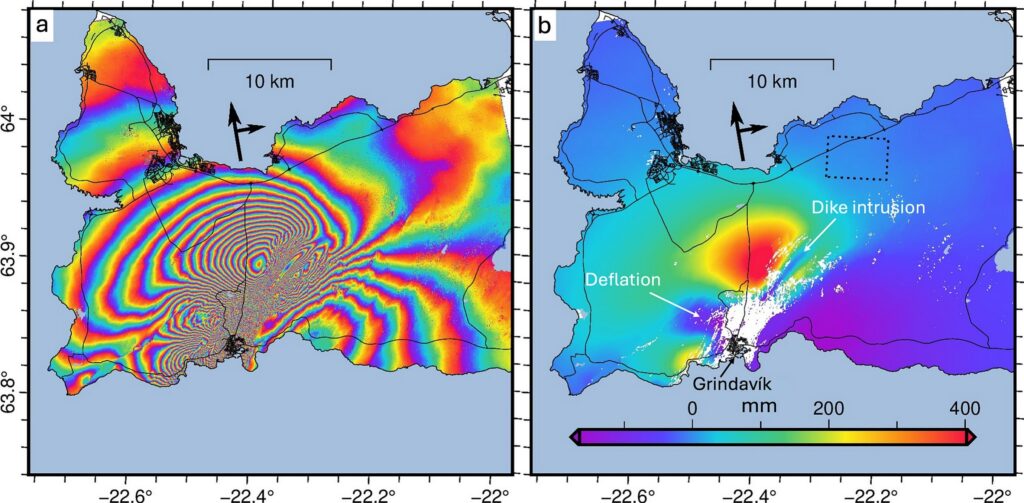
Later in the afternoon, Weiyu Zheng presented in the session GI6.1 Remote sensing for environmental monitoring. The talk, Towards reliable X-band InSAR monitoring of complex deformation: Insights from the 2024-2025 Fentale-Dofen Magma Intrusion, focused on improving InSAR unwrapping results for complex volcanic deformation, particularly during dike intrusion events.
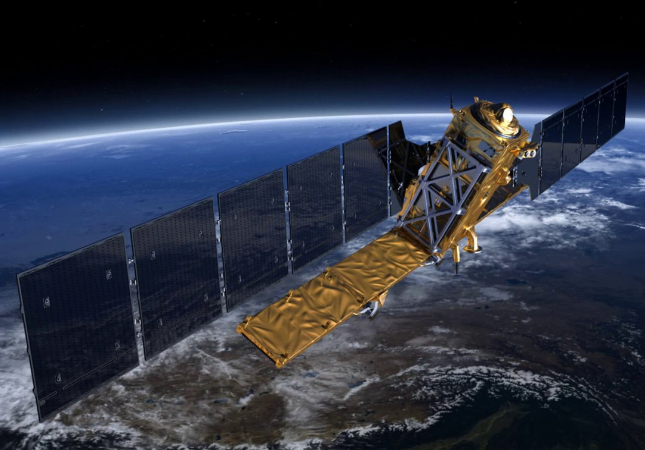
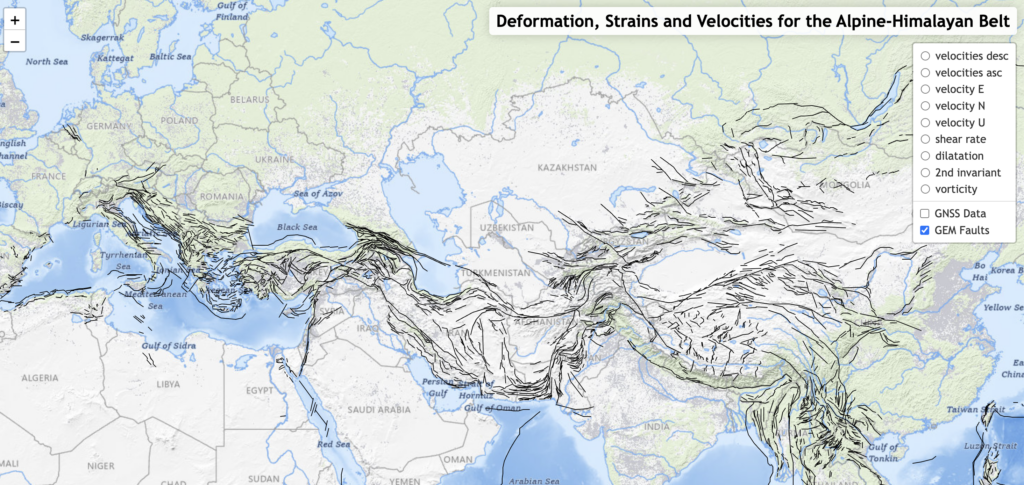
Immediately afterwards, Ben Ireland presented in TS2.1 Rift evolution: from continental inception to seafloor spreading. The talk, Along-rift variations in magma system geometry observed using Sentinel-1 InSAR data from the East African Rift System, highlighting that magma systems along the East African Rift evolve from horizontally to vertically dominated geometries, indicating structural differences in magmatic system architecture.
The day concluded with Lin Way presenting her poster in GMPV10.12 Volcanic processes: tectonics, deformation, geodesy, unrest. Her presentation, Reservoir connectivity in a continental rift: Insights from geodetic observations during the 2024-2025 dike intrusions at Fentale, Main Ethiopian Rift, showed that tracking the evolving volume ratio between dike intrusion and magma reservoir deflation provides new insights into changes to the magmatic system.
Wednesday: Science into Policy
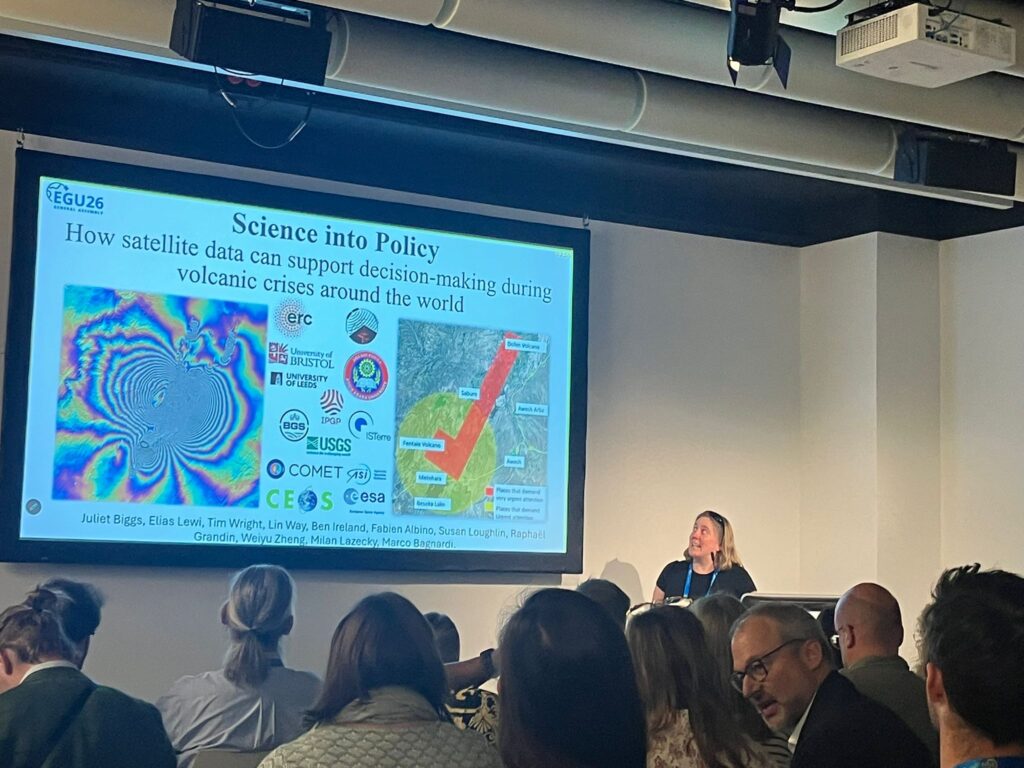
Wednesday is featured by Prof. Juliet Biggs presenting in the session EOS4.6 Strengthening Policy Through Science: Insights from the interface. Her talk, Science into Policy: how satellite data can support decision-making during volcanic crises around the world – a recent example from East Africa, highlighted how satellite observations and geodetic analysis can directly support decision-making during volcanic crises.
Thursday: Dyke Seismicity and Geodetic Methods
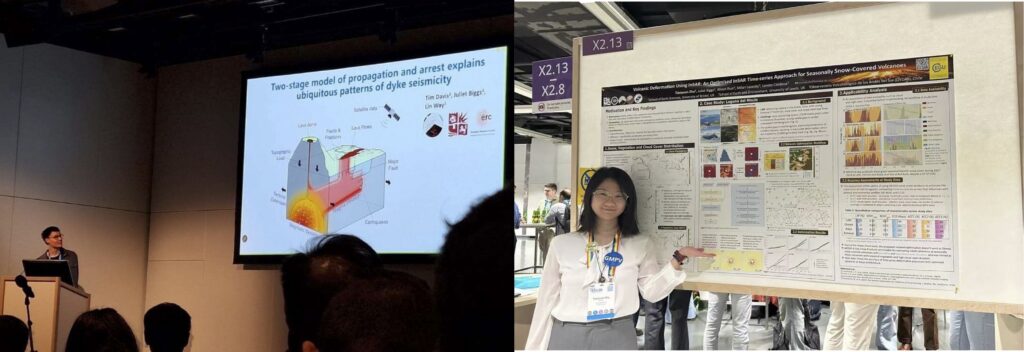
Thursday started with Tim Davis presenting in SM7.1 Beyond the Catalog: Unraveling the mechanisms of Earthquake Swarms and Sequences in Tectonic and Volcanic Regions. The session began with two talks on the seismicity of the 2025 Santorini intrusion, leading nicely into his talk, Two-stage model of propagation and arrest explains ubiquitous patterns of dyke seismicity. He showed that a 3D hydromechanical model can explain the observed patterns of dyke-related seismicity and deformation across multiple intrusions both before and after arrest.
In the afternoon, Tianyuan Zhu presented her poster in G3.3 Space, Land and Marine geodetic methods to advance lithospheric processes understanding and hazards assessment. Her presentation, Monitoring Volcanic Deformation Using InSAR: An Optimised InSAR Time-Series Approach for Seasonally Snow-Covered Volcanoes, focused on improving InSAR time-series analysis in seasonally snow-covered volcanic regions, enhancing the reliability of deformation measurements in challenging environments.
Friday: Volcanic Emissions
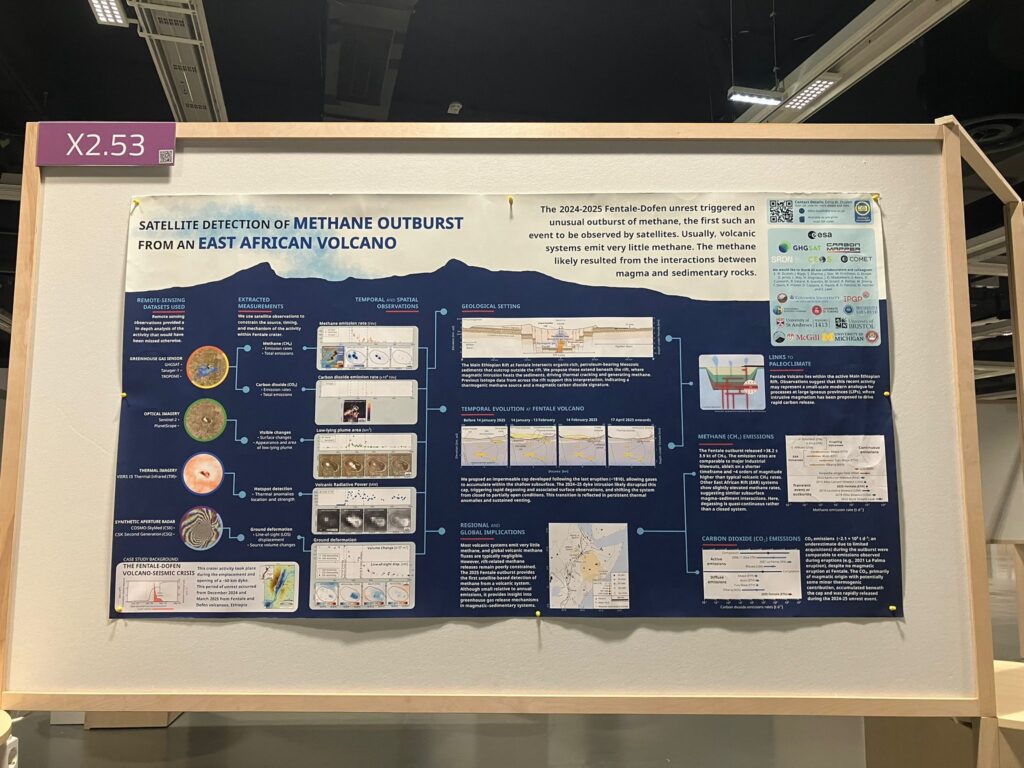
The week concluded with Edna Dualeh’s poster in the session GMPV11.5 Volcanic Eruptions and Climate: Observations. Her work, Satellite detection of methane outburst from an East African volcano, showed the first satellite observations of large, transient methane emission associated with magma–sediment interactions during a volcanic intrusion. Although Edna was unable to attend EGU, her work, presented on her behalf by Tim, attracted strong interest and discussion throughout the session.
Concluding remarks
EGU 2026 was a busy and rewarding week for the Bristol COMET Group, with contributions across oral, poster, and PICO sessions covering a wide range of topics in volcanology, tectonics, remote sensing, and decision support. It was an excellent opportunity to share new results, exchange ideas, and receive feedback from colleagues working on similar problems around the world. Beyond the presentations, the meeting also provided valuable time for the group to catch up with collaborators and discuss ongoing and future research in an inspiring scientific environment.