Observations of Deformation
| Volcano number: | 358057 |
|---|---|
| Region: | South America |
| Country: | Chile |
| Geodetic measurements? | Yes |
| Deformation observation? | Yes |
| Measurement method(s): | InSAR |
| Duration of observation: | 1993-1999 |
| Inferred cause(s) of deformation: | Magmatic |
| Characteristics of deformation: | We detect inflation of Cerro Hudson volcano following its 1991 eruption, and use spherical and non-spherical models to constrain the source of deformation to be between 4 and 8 km below sea level. We measure the rate of deformation to be about 5 cm/year in the radar line-of-sight, and infer that the maximum deformation could exceed 10 cm/year in the center of the caldera Ref 1. |
| Reference(s): | Pritchard, M. E., & Simons, M. (2004). An InSAR‐based survey of volcanic deformation in the southern Andes. Geophysical research letters, 31(15). |
| Fournier, T. J., Pritchard, M. E., & Riddick, S. N. (2010). Duration, magnitude, and frequency of subaerial volcano deformation events: New results from Latin America using InSAR and a global synthesis. Geochemistry, Geophysics, Geosystems, 11(1). | |
| Location: | -45.9, -72.97 |
| REST API endpoint (JSON): | https://comet.nerc.ac.uk/wp-json/volcanodb/v1/volcano/4332 |
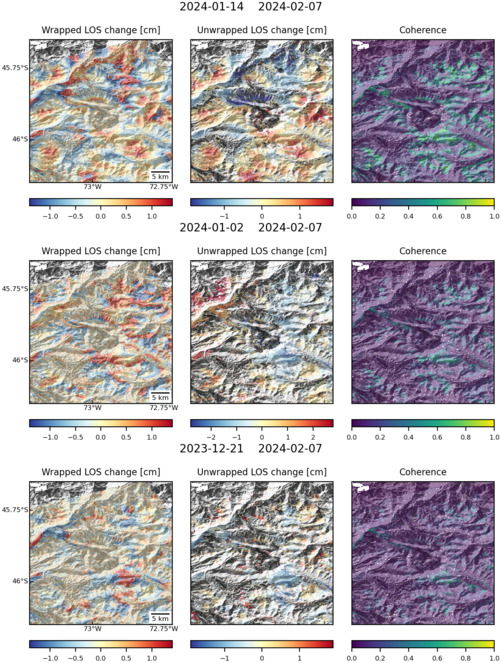
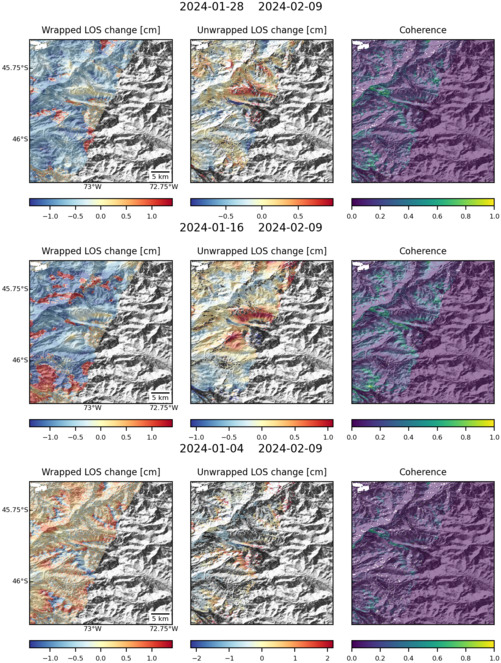
Latest Sentinel-1 Data
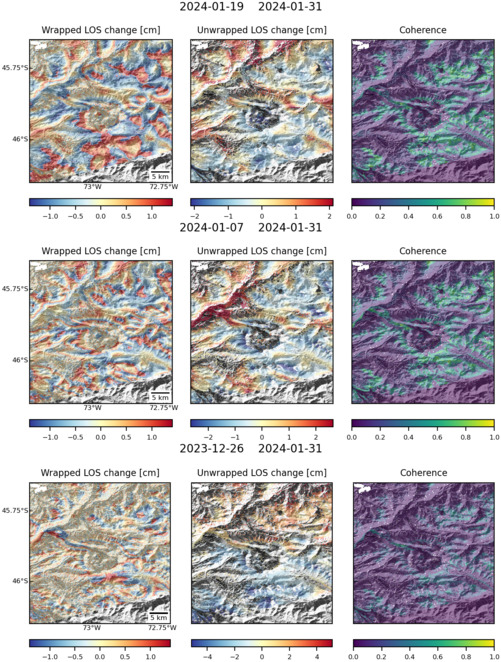
Size: 501px x 663px (177.33 KB)
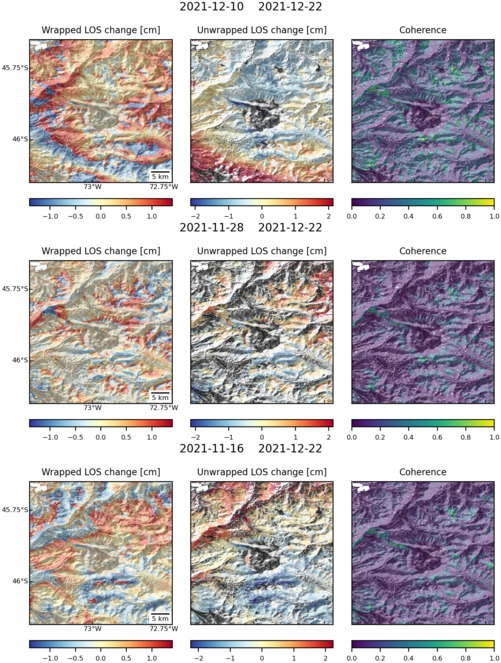
Size: 501px x 663px (180.20 KB)
Size: 501px x 663px (178.27 KB)
Size: 501px x 663px (163.48 KB)
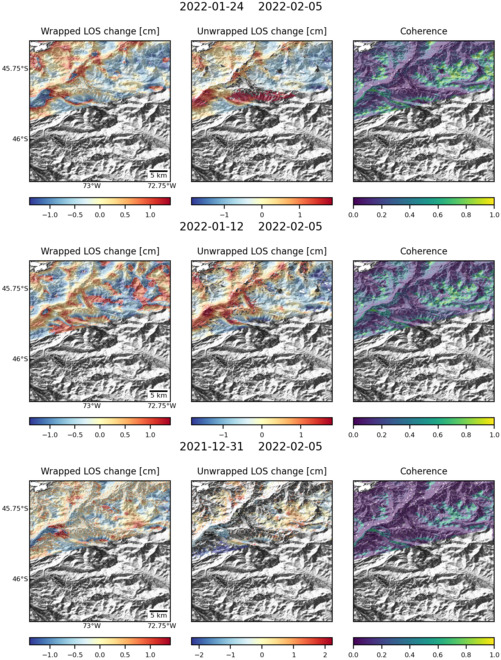
Size: 501px x 663px (168.56 KB)