
Observations of Deformation
| Volcano number: | 311290 |
|---|---|
| Region: | Alaska |
| Country: | United States |
| Geodetic measurements? | Yes |
| Deformation observation? | Yes |
| Measurement method(s): | InSAR, GPS - continuous, GPS - campaign |
| Duration of observation: | 1992 - 2010 |
| Inferred cause(s) of deformation: | Magmatic, Surface deposits, Collapse of a groundwater lens |
| Characteristics of deformation: | The center of Okmok caldera uplifted >14 cm during 1992–1993 and ~6 cm during 1993–1995. The caldera then subsided 1 – 2 cm in 1995 – 1996 prior to the start of an eruption in 1997. During this eruption the caldera subsided more than 1.2 m. Prior to the 1997 eruption, the source volume increased by ~0.006 km³. During the 1997 eruption the volume decrease was ~0.047 km³. |
| Reference(s): | Lu, Z., and Dzurisin, D., 2014, InSAR imaging of Aleutian volcanoes: Chichester, UK, Springer-Praxis, 390 p. |
| Miyagi, Y., Freymueller, J. T., Kimata, F., Sato, T., & Mann, D. (2004). Surface deformation caused by shallow magmatic activity at Okmok volcano, Alaska, detected by GPS campaigns, 2000–2002. Earth, Planets and Space,56(10), e29–e32. | |
| Biggs, J., Lu, Z., Fourneir, T., & Freymueller, J. (2010). Magma flux at Okmok Volcano, Alaska from a joint inversion of continuous GPS, campaign GPS and InSAR. Journal of Geophysical Research, 115, B12401. doi:10.1029/2010JB007577. | |
| Freymueller, J. T., & Kaufman, A. M. (2010). Changes in the magma system during the 2008 eruption of Okmok volcano, Alaska, based on GPS measurements. Journal of Geophysical Research, 115 (B12415), doi:10.1029/2010JB007716. | |
| U.S. Geological Survey Alaska Volcano Observatory (AVO) website http://www.avo.alaska.edu/volcanoes/volcinfo.php?volcname=Okmok | |
| Location: | 53.43, -168.13 |
| REST API endpoint (JSON): | https://comet.nerc.ac.uk/wp-json/volcanodb/v1/volcano/5219 |
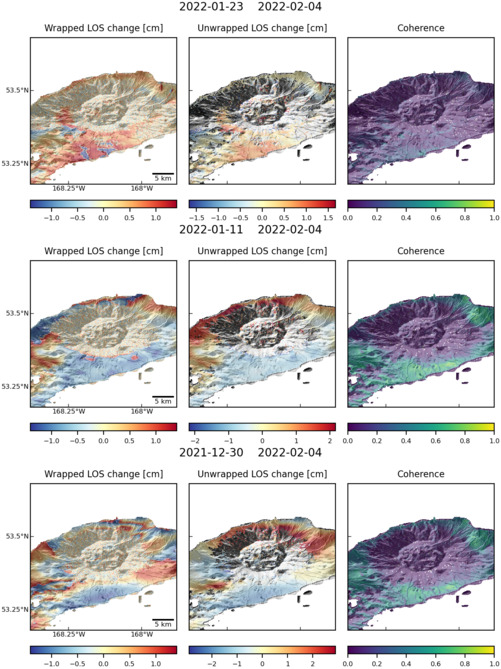
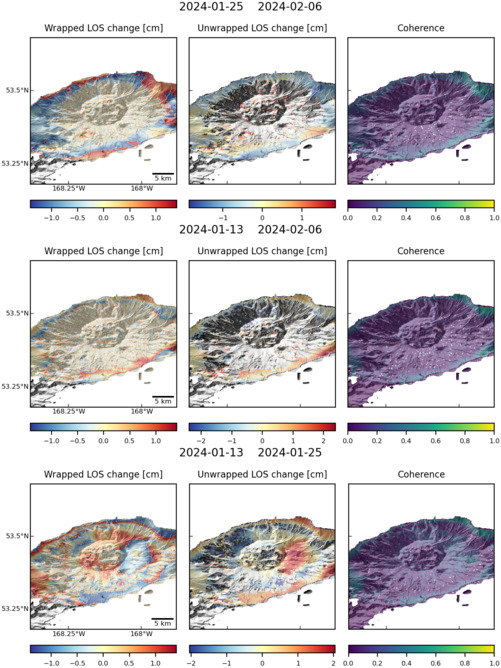
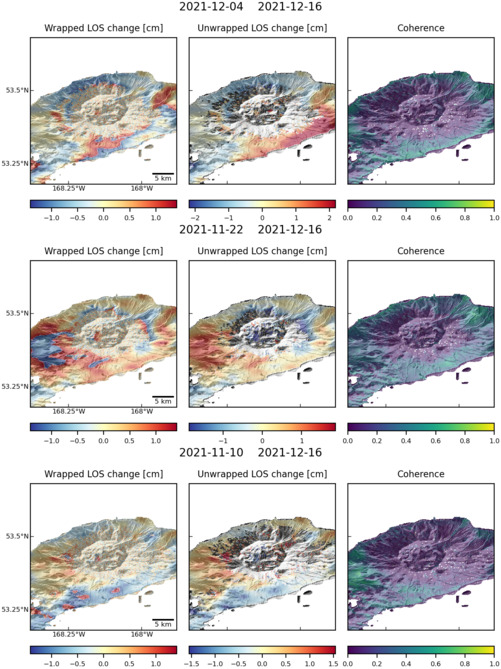
Latest Sentinel-1 Data
Size: 501px x 669px (128.04 KB)
Size: 501px x 669px (125.22 KB)
Size: 501px x 669px (126.72 KB)