Observations of Deformation
| Volcano number: | 261080 |
|---|---|
| Region: | Indonesia |
| Country: | Sumatra |
| Geodetic measurements? | Yes |
| Deformation observation? | Yes |
| Measurement method(s): | InSAR, GPS - continuous |
| Duration of observation: | 06/2006-06/2009; 02/2007-01/2011; 03/2011-10/2013 |
| Inferred cause(s) of deformation: | Magmatic |
| Characteristics of deformation: | The ongoing eruptions of Mount Sinabung, the first of which occurred in August 2010 and the most recent of which began in September 2013, precipitated several analyses of observational data preceding and immediately following the initial event. Many of these studies utilise ALOS InSAR data, such as the 2012 paper by Chaussard & Amelung, which involved an InSAR survey conducted over the West Sunda Arc, covering 400,000km2 between mid-2006 and mid-2009. This study noted an unsteady inflation of 3-8cm/yr during this period, with the peak uplift (8cm) occurring between 2007-2008. The source was determined to be a shallow magma reservoir, at a depth of approximately 0.9km below sea level. The same study noted similar patterns of inflation at two other Sumatran volcanoes, Kerinci and Slamet, both of which also erupted within 0.3-2 years of the end of the study period, prompting the authors to conclude that inflation may be a common precursor to eruptive activity in this region. |
| Reference(s): | Chaussard, E. and Amelung, F. 2012. Precursory inflation of shallow magma reservoirs at west Sunda volcanoes detected by InSAR. Geophysical Research Letters, 39 (12) DOI: 10.1029/2012GL053817 |
| Lee, C-W. et al. 2015. Volcanic activity analysis of Mt. Sinabung in Indonesia using InSAR and GIS techniques. IEEE International Geoscience and Remote Sensing Symposium, 4793-4796 | |
| Kriswati, E., Kuncoro, H. and Meilano, I. 2015. Low Rate of Sinabung Deformation Inferred by GPS Measurement. AIP Conference Proceedings, 1658 DOI: 10.1063/1.4915046 | |
| Location: | 3.17, 98.392 |
| REST API endpoint (JSON): | https://comet.nerc.ac.uk/wp-json/volcanodb/v1/volcano/3565 |
Latest Sentinel-1 Data
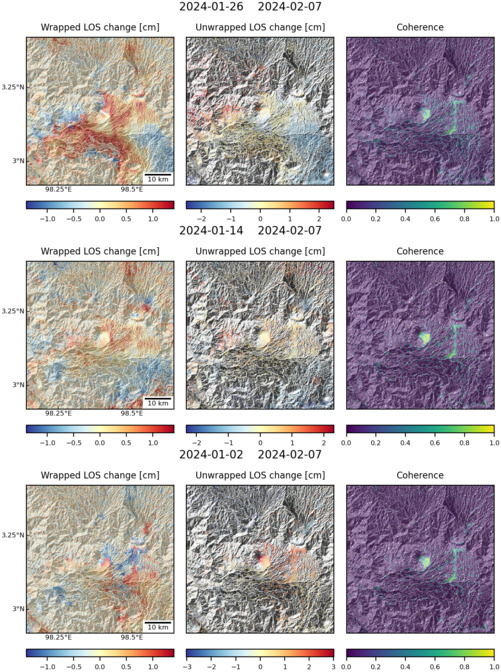
Size: 501px x 672px (180.98 KB)
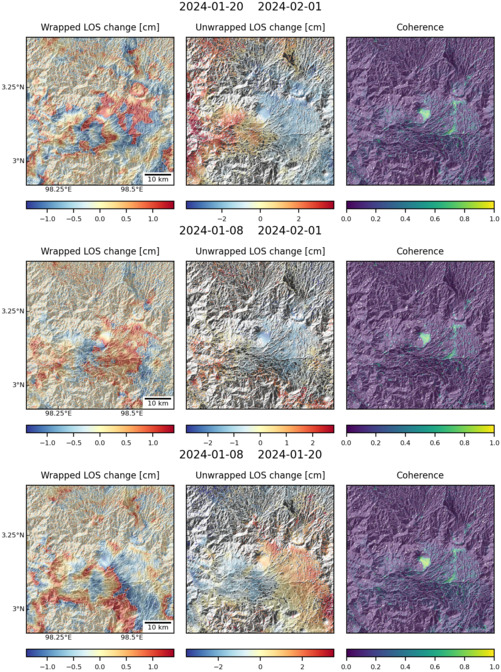
Size: 501px x 672px (185.79 KB)