Name of internship student: Geri Peykova, University of Oxford, Summer 2023
Why Measure Volcanic Ash Plume Heights?
Volcanic eruptions are natural phenomena that can have significant impacts on both local and global scales. One aspect of monitoring volcanic activity is measuring the height of the ash plumes they generate. Understanding the height of volcanic ash plumes is important for aviation safety, hazard management, and mitigating potential impacts on human health and the environment.
Aviation Safety
Volcanic ash poses a threat to aircraft engines, as it can cause engine failure by clogging fuel and cooling systems. Additionally, ash particles can scratch cockpit windows, obscure visibility, and interfere with aircraft navigation systems. By accurately measuring ash plume heights, aviation authorities can issue timely warnings and reroute flights to avoid hazardous areas, minimizing the risk to passengers and crew.
Hazard Management and Mitigation
Measuring volcanic ash plume heights is also crucial for hazard management and mitigation efforts. Ash plumes pose significant risks to human health, agriculture, infrastructure, and the environment. Understanding the height and dispersion of ash clouds allows authorities to assess the potential impact zones and implement appropriate measures to protect affected populations, such as evacuations, ashfall advisories, and distribution of respiratory protection equipment.
Satellite-Based Monitoring of Volcanic Eruptions
Satellites are an important tool for monitoring volcanic eruptions as they provide global coverage, allowing scientists to study volcanic activity anywhere on Earth, including remote and inaccessible regions. These spacecraft provide imagery of eruptions using various channels that capture different wavelengths of light ranging from visible to infrared and beyond. Each wavelength provides unique information about the eruption. For example, visible light imagery reveals the visual appearance of volcanic plumes and lava flows, while infrared imagery detects thermal emissions and provides temperature measurements. The data can also be utilized to find the heights of the eruptions.
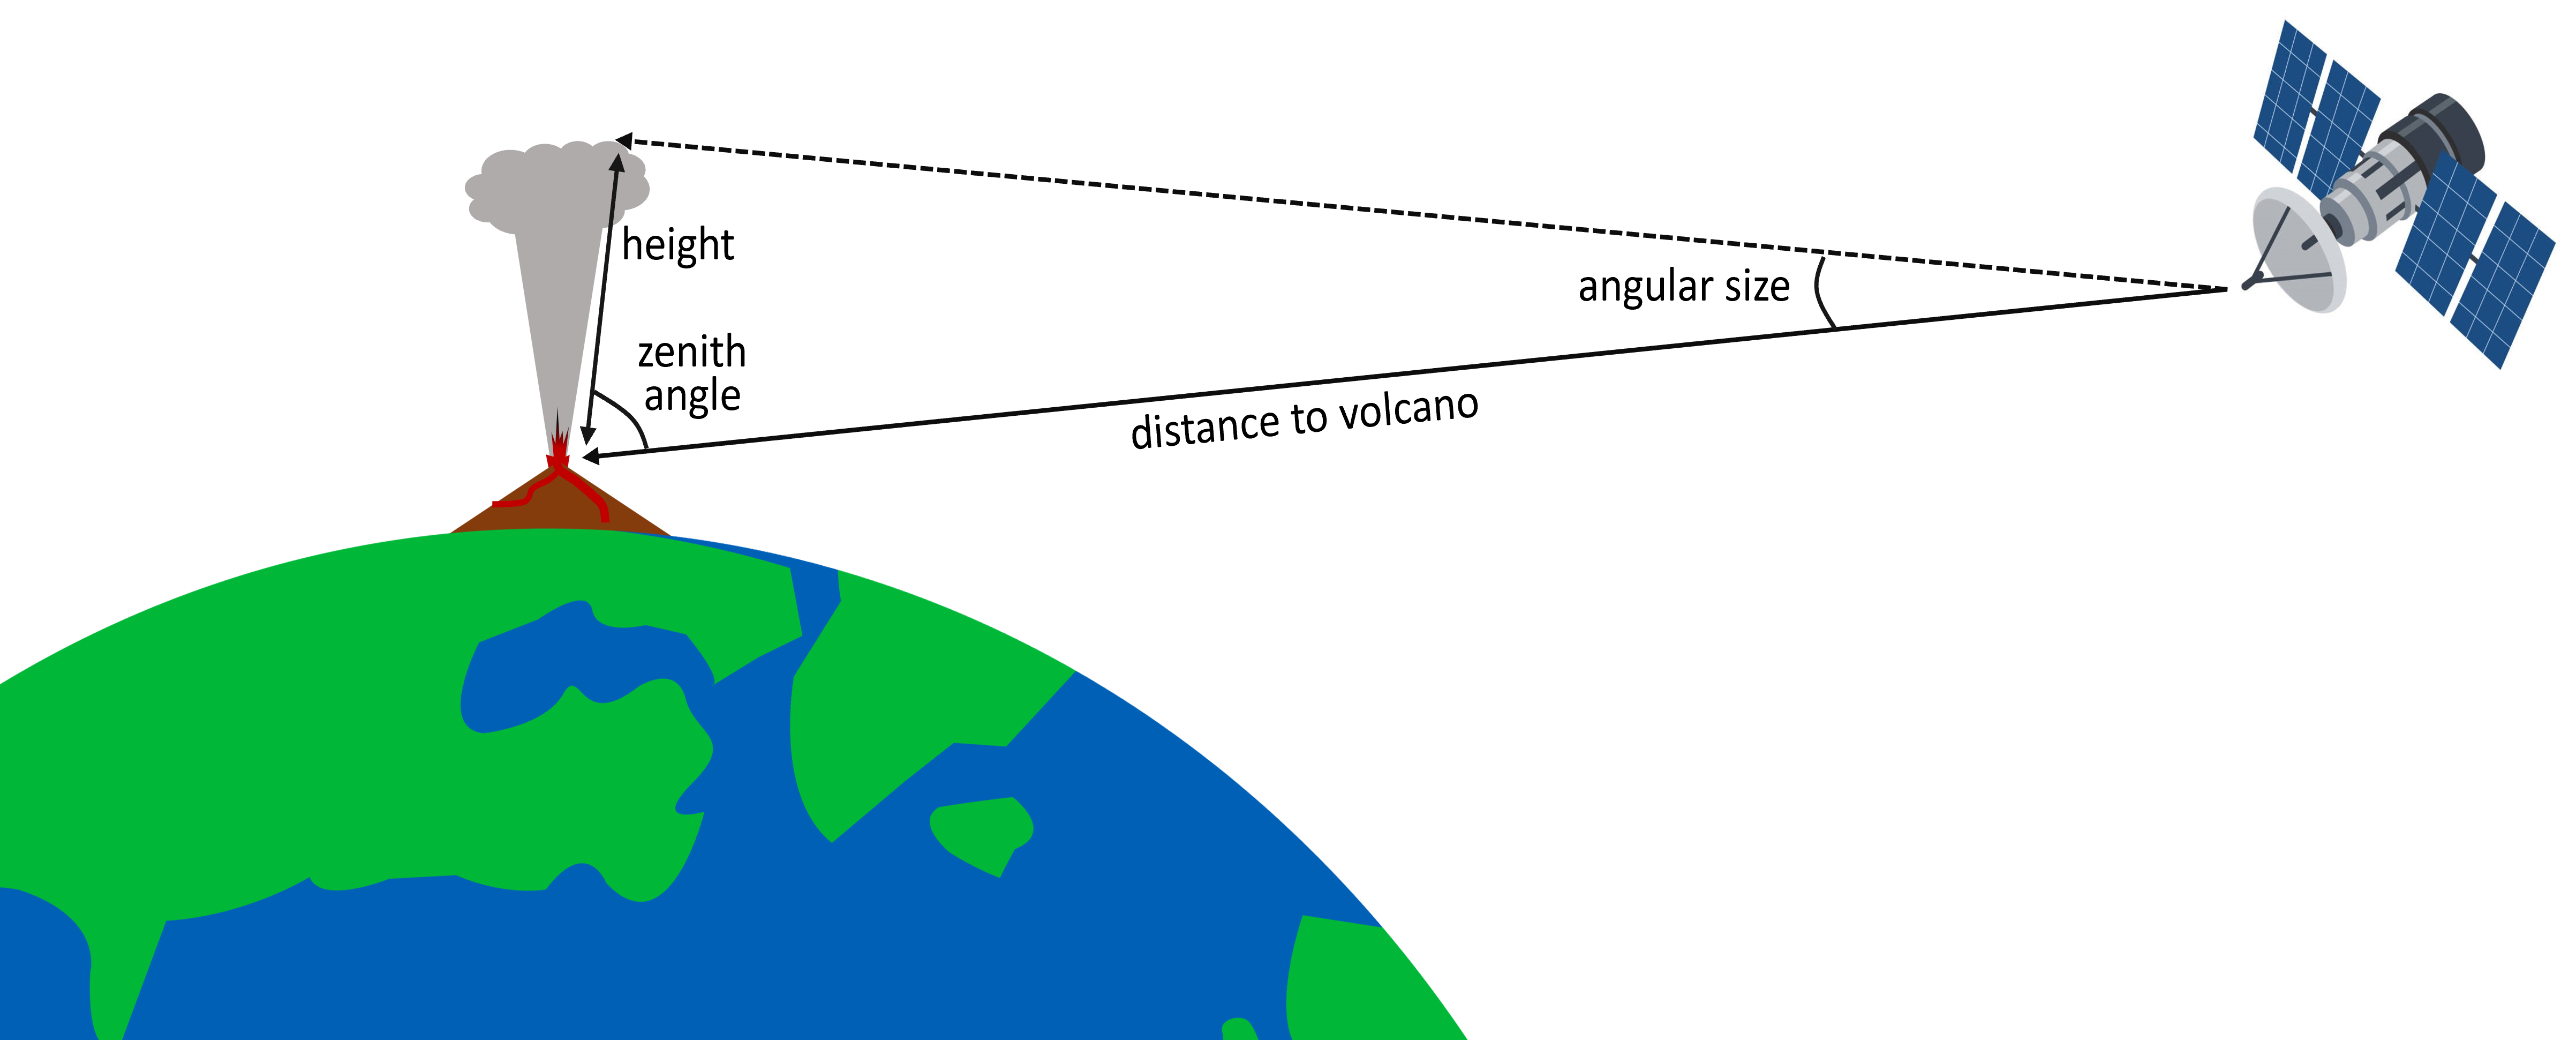
Geometric Approach
Perhaps the most intuitive method for measuring volcanic ash plume heights is direct observation. The geometric approach involves imaging the plume from a satellite positioned to look sideways at the eruption and recording its angular size. We can then obtain an estimate of the height of the plume using trigonometry and the known distance to the volcano and zenith angle. The accuracy of this method is limited by the spatial resolution of the satellite instruments, which is typically around 500 meters for visual channels. Night time observations however rely on infrared channels, which have a coarser resolution of around 2 kilometers.
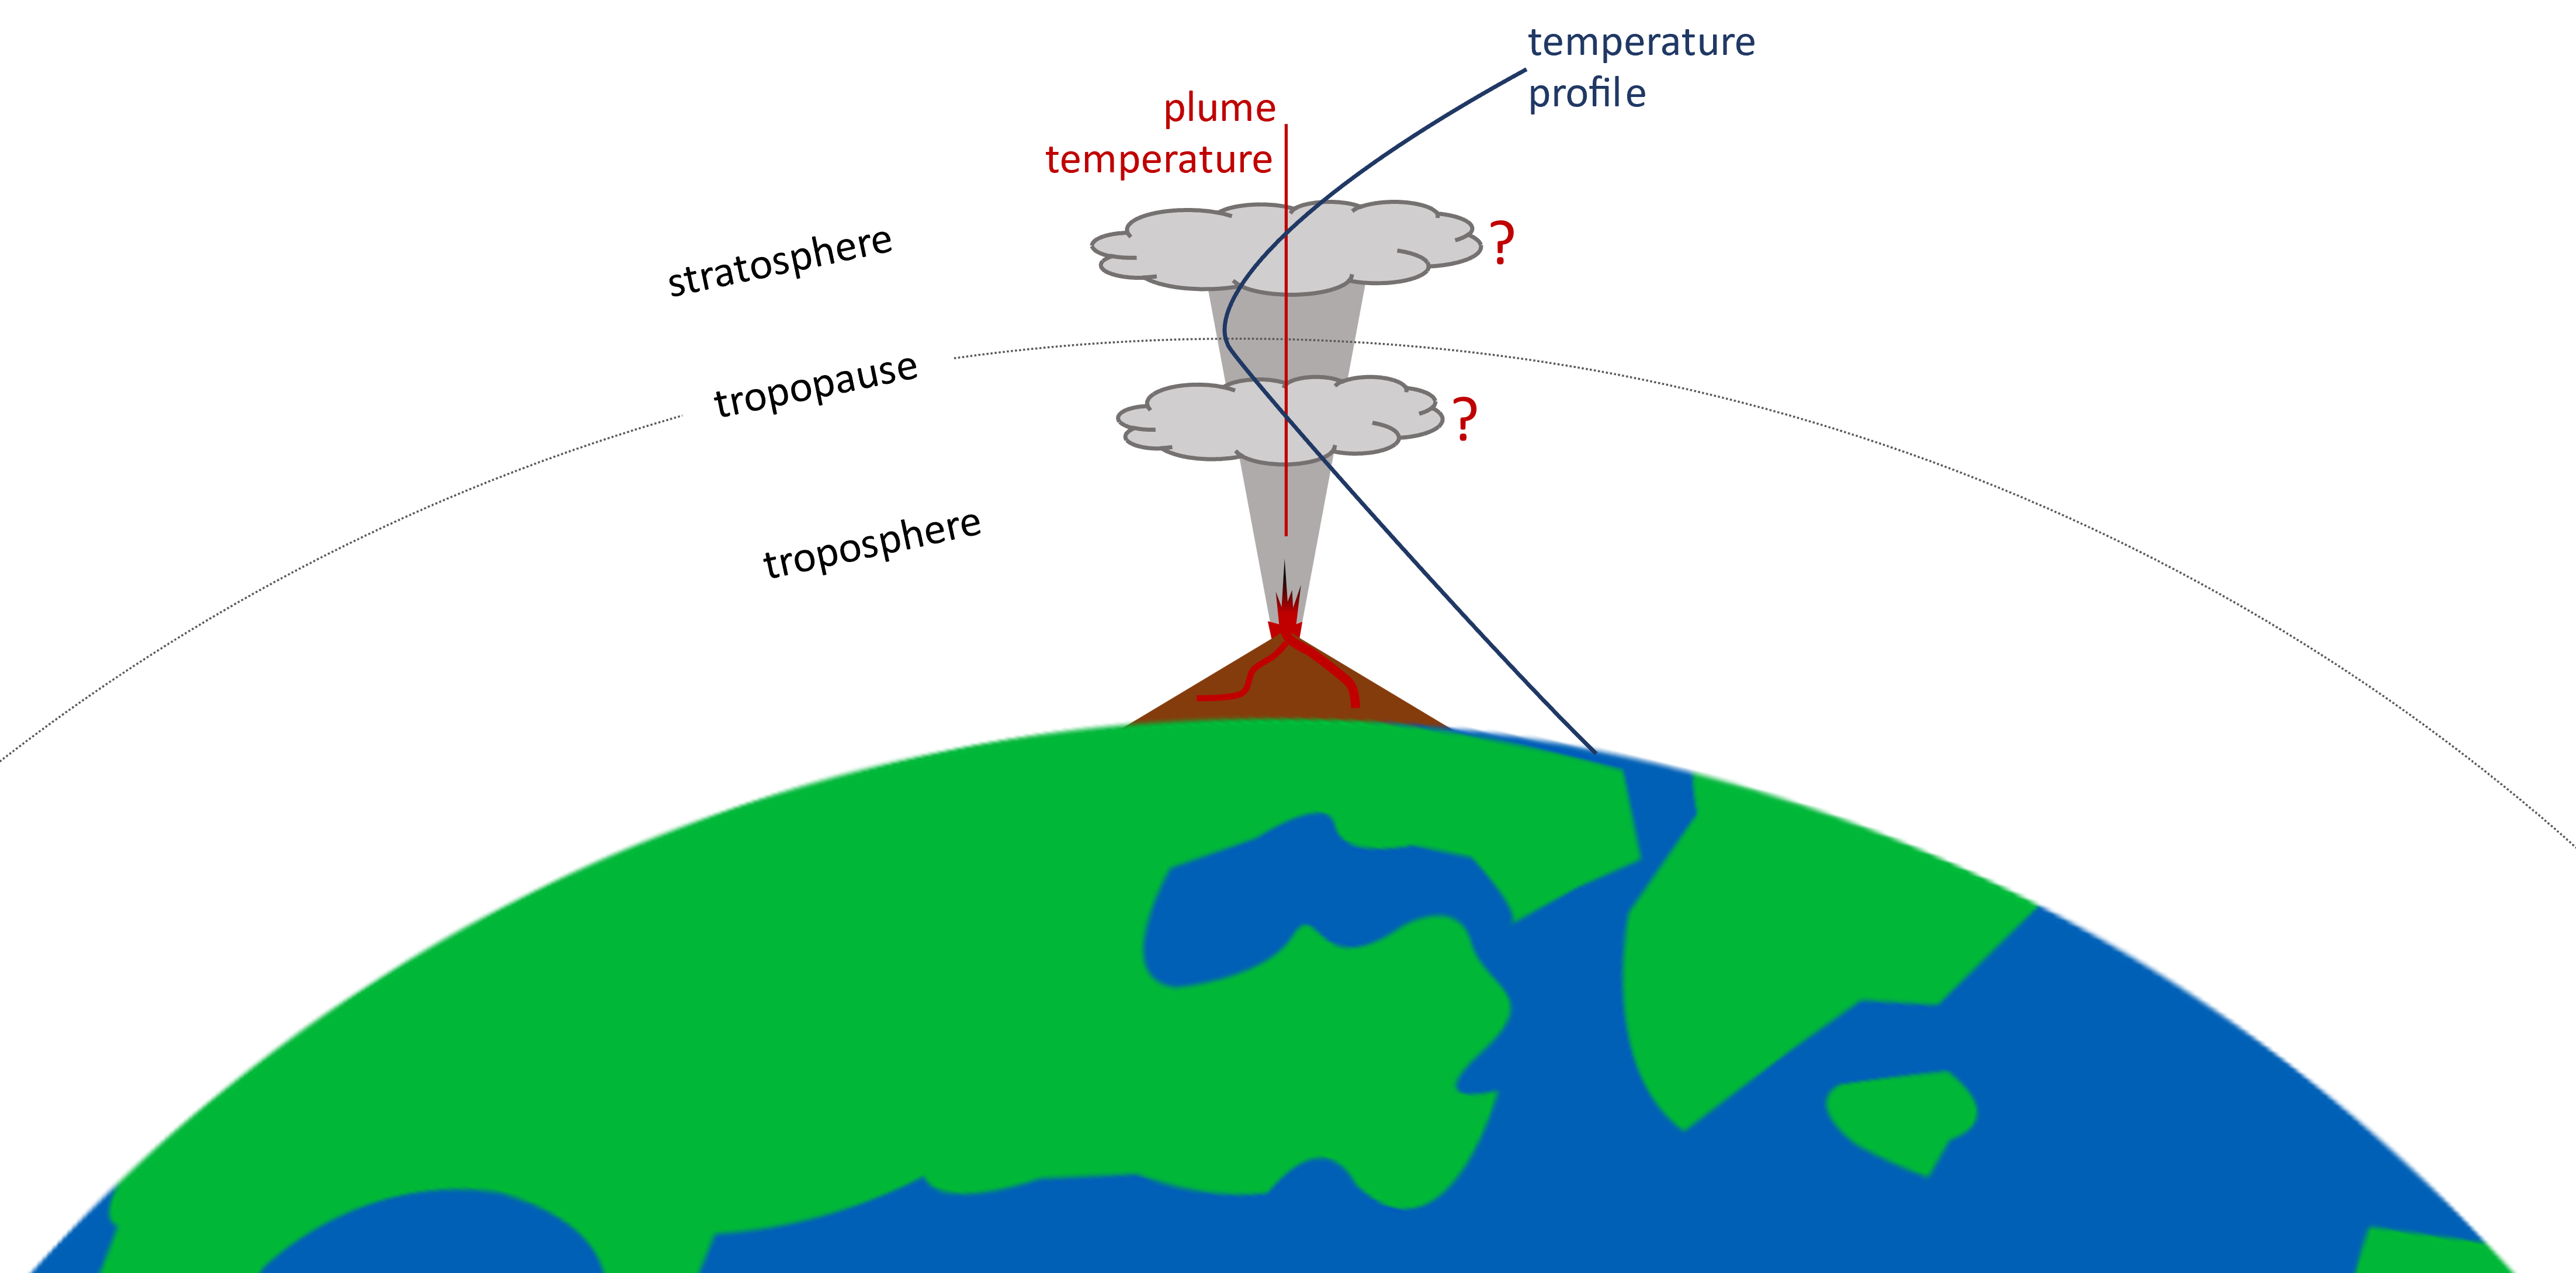
Brightness Temperature Method
The height of the eruption can also be inferred from data collected by a satellite positioned above the volcano, such as through the application of the brightness temperature method. For this technique, we use the fact that the top of the volcanic plume is in equilibrium with its surroundings and hence must match the ambient temperature. To get its altitude, the temperature of the ash cloud is measured from the infrared channels of the satellite and compared to the temperature profile of the atmosphere, derived from satellite data, weather stations and buoys.
However, the structure of the atmosphere adds complexity to this measurement. In the troposphere, which extends from the Earth’s surface to the tropopause, temperature typically decreases with altitude. Conversely, in the stratosphere beyond the tropopause, temperature begins to increase with altitude. This temperature inversion creates multiple potential heights at which the plume’s temperature matches that of its surroundings. It’s important to distinguish between plumes reaching the stratosphere and those confined to the troposphere as gases and pollutants injected into the stratosphere remain there longer and can impact climate dynamics.
Introducing a New Method
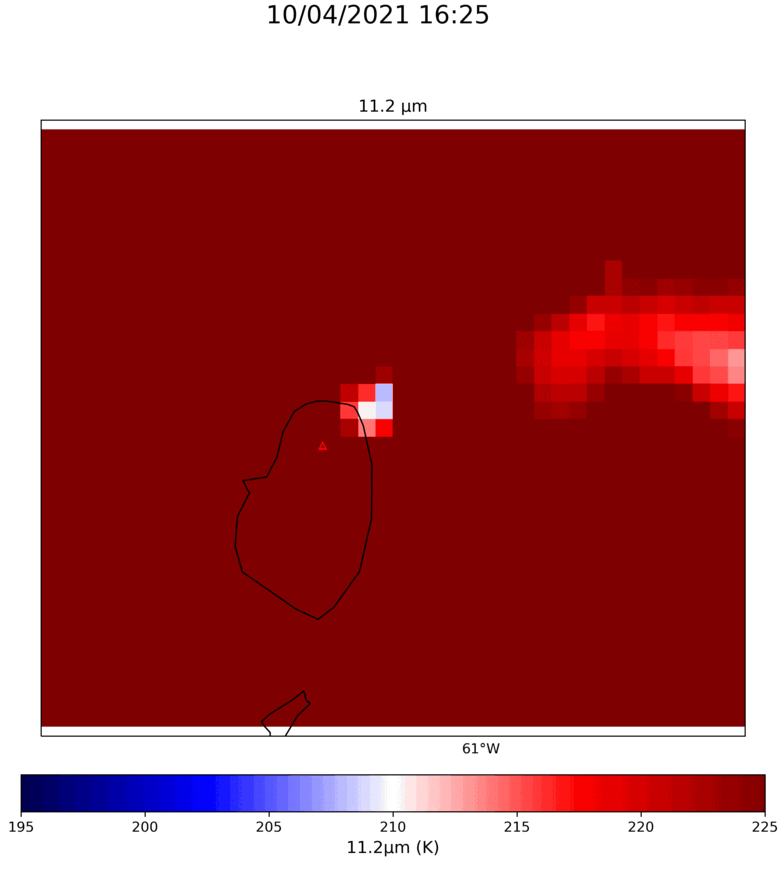
In April 2021, the GOES-16 satellite observed the eruption of La Soufriere on the island of St. Vincent taking an overhead image every minute. The tenfold increase in temporal resolution allowed us to track the evolution of the ash plume in unprecedented detail and capture high-frequency and short-duration events that otherwise occur ‘in between takes’. One of the interesting features that we observed, the formation of waves within the plume, motivated the development of a novel method for measuring the heights of the eruption.
Plume Dynamics
The waves can be seen in the infrared images of the plume as light and dark blue fronts propagating radially outwards from the volcano. These temperature variations correspond to fluctuations in the altitude of air parcels within the ash cloud.
To understand the origin of these waves, imagine a rubber duck floating in a bathtub. When carefully placed in the water, the duck rests at what we term the “level of neutral buoyancy” (LNB) – the level at which its weight is perfectly balanced by the buoyant force. However, if the duck is dropped into the water from a height, it bounces up and down before eventually settling at the LNB. In the latter scenario, the duck’s inertia causes it to sink below LNB. As it sinks, it displaces water, creating an upward buoyant force. This pushes the duck back up and it overshoots the LNB slightly causing it to fall back down again. Similarly, rising air parcels within the ash plume exceed the LNB and experience buoyant forces due to the density difference between the surrounding atmosphere and the volcanic ash-laden air. When these air parcels surpass the level of neutral buoyancy, they oscillate around this equilibrium level, generating waves.
Buoyancy Waves Method
The frequency at which these waves oscillate depends on the pressure and temperature of the surrounding air. Similarly to the brightness temperature method, we can use atmospheric data to reconstruct a frequency profile, which indicates the allowed frequency at different altitudes. Then to obtain the height, we just need to match it to the measured frequency of waves in the plume. This approach produces a single solution near the tropopause so we can uniquely determine the position of the plume. Moreover, the frequency varies strongly with altitude which significantly reduces the uncertainty of the measurement from hundreds to tens of meters. Finally, using infrared channels rather than visual means that we are not limited to daytime observations.
Conclusion
Observing volcanic eruptions and accurately measuring the height of ash plumes are vital for understanding and mitigating their impacts on society and the environment. Techniques such as the geometric approach, brightness temperature and buoyancy waves methods provide valuable insights into volcanic activity, while advancements in satellite technology continue to enhance our monitoring capabilities. By combining satellite data with innovative methods and scientific insights, we can improve our understanding of volcanic processes and better protect communities from volcanic hazards.