We are delighted to celebrate COMET Scientists Professor Marie Edmonds (University of Cambridge) and Professor David Pyle (University of Oxford), who are amongst the outstanding and distinguished group of scientists elected Fellows of the Royal Society this year. This prestigious title is awarded to scientists who have made exceptional contributions to science, and the ground-breaking work that both professors have undertaken throughout their careers is certainly deserving of this honour.
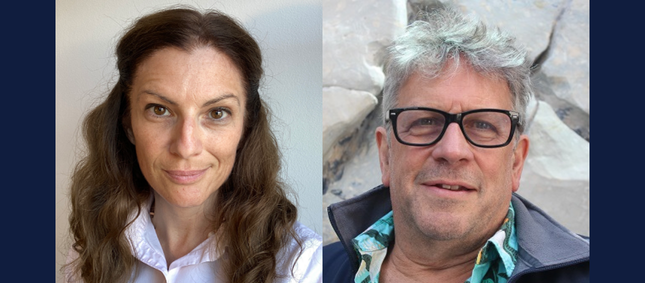
Professor Marie Edmonds FRS – University of Cambridge
Professor Marie Edmonds is an Earth Scientist whose interdisciplinary research spans volcanology, igneous petrology, tectonics, atmospheric science and economic geology. Her work focuses on understanding how certain elements move through the Earth system – elements that are essential for creating a habitable planet, powering volcanic eruptions, and concentrating valuable metals in the Earth’s crust.
Professor Edmonds has significantly advanced our understanding of how volcanoes work and their broader impacts on our planet. She has developed new ways to monitor volcanoes by studying the gases they release, helping scientists better predict when eruptions might occur and assess the risks they pose to nearby communities. Her research has also revealed how carbon moves through the Earth over millions of years, providing vital insights into long-term climate change. She has shown how hot, mineral-rich fluids from deep within the Earth create the metal deposits we rely on for modern technology, and has reconstructed huge ancient eruptions to understand how they altered Earth’s climate and environment in the past.
As Professor of Volcanology and Petrology and Head of the Earth Sciences department at the University of Cambridge, Professor Edmonds also serves as the Ron Oxburgh Fellow and Vice President of Queens’ College, Cambridge. Her excellence has also been recognised through membership of the Academia Europaea and the American Geophysical Union College of Fellows.
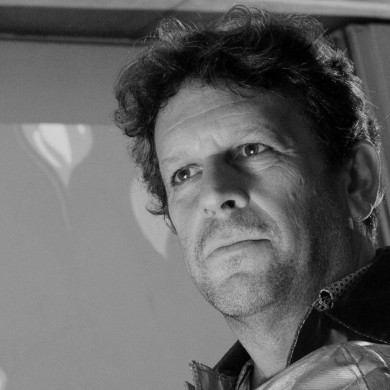
Professor David Pyle FRS – University of Oxford
Professor David Pyle’s fascination with volcanoes began early; he saw his first volcano at age seven in Chile, sparking a lifelong interest that would shape his distinguished career. After studying geological sciences at the University of Cambridge and completing his PhD on the volcanic histories of Santorini, Greece, and Oldoinyo Lengai, Tanzania, he has dedicated his research to quantifying the scale of volcanic eruptions and understanding their processes and impacts.
As Professor of Earth Sciences at the University of Oxford, Professor Pyle’s research combines geological fieldwork with archival records to build comprehensive pictures of volcanic activity. His work includes creating detailed eruptive histories of individual volcanoes to global-scale analyses, encompassing young and active volcanoes on Earth as well as investigations relevant to the early Earth and other planetary bodies. This broad perspective has contributed significantly to our understanding of volcanism across space and time.
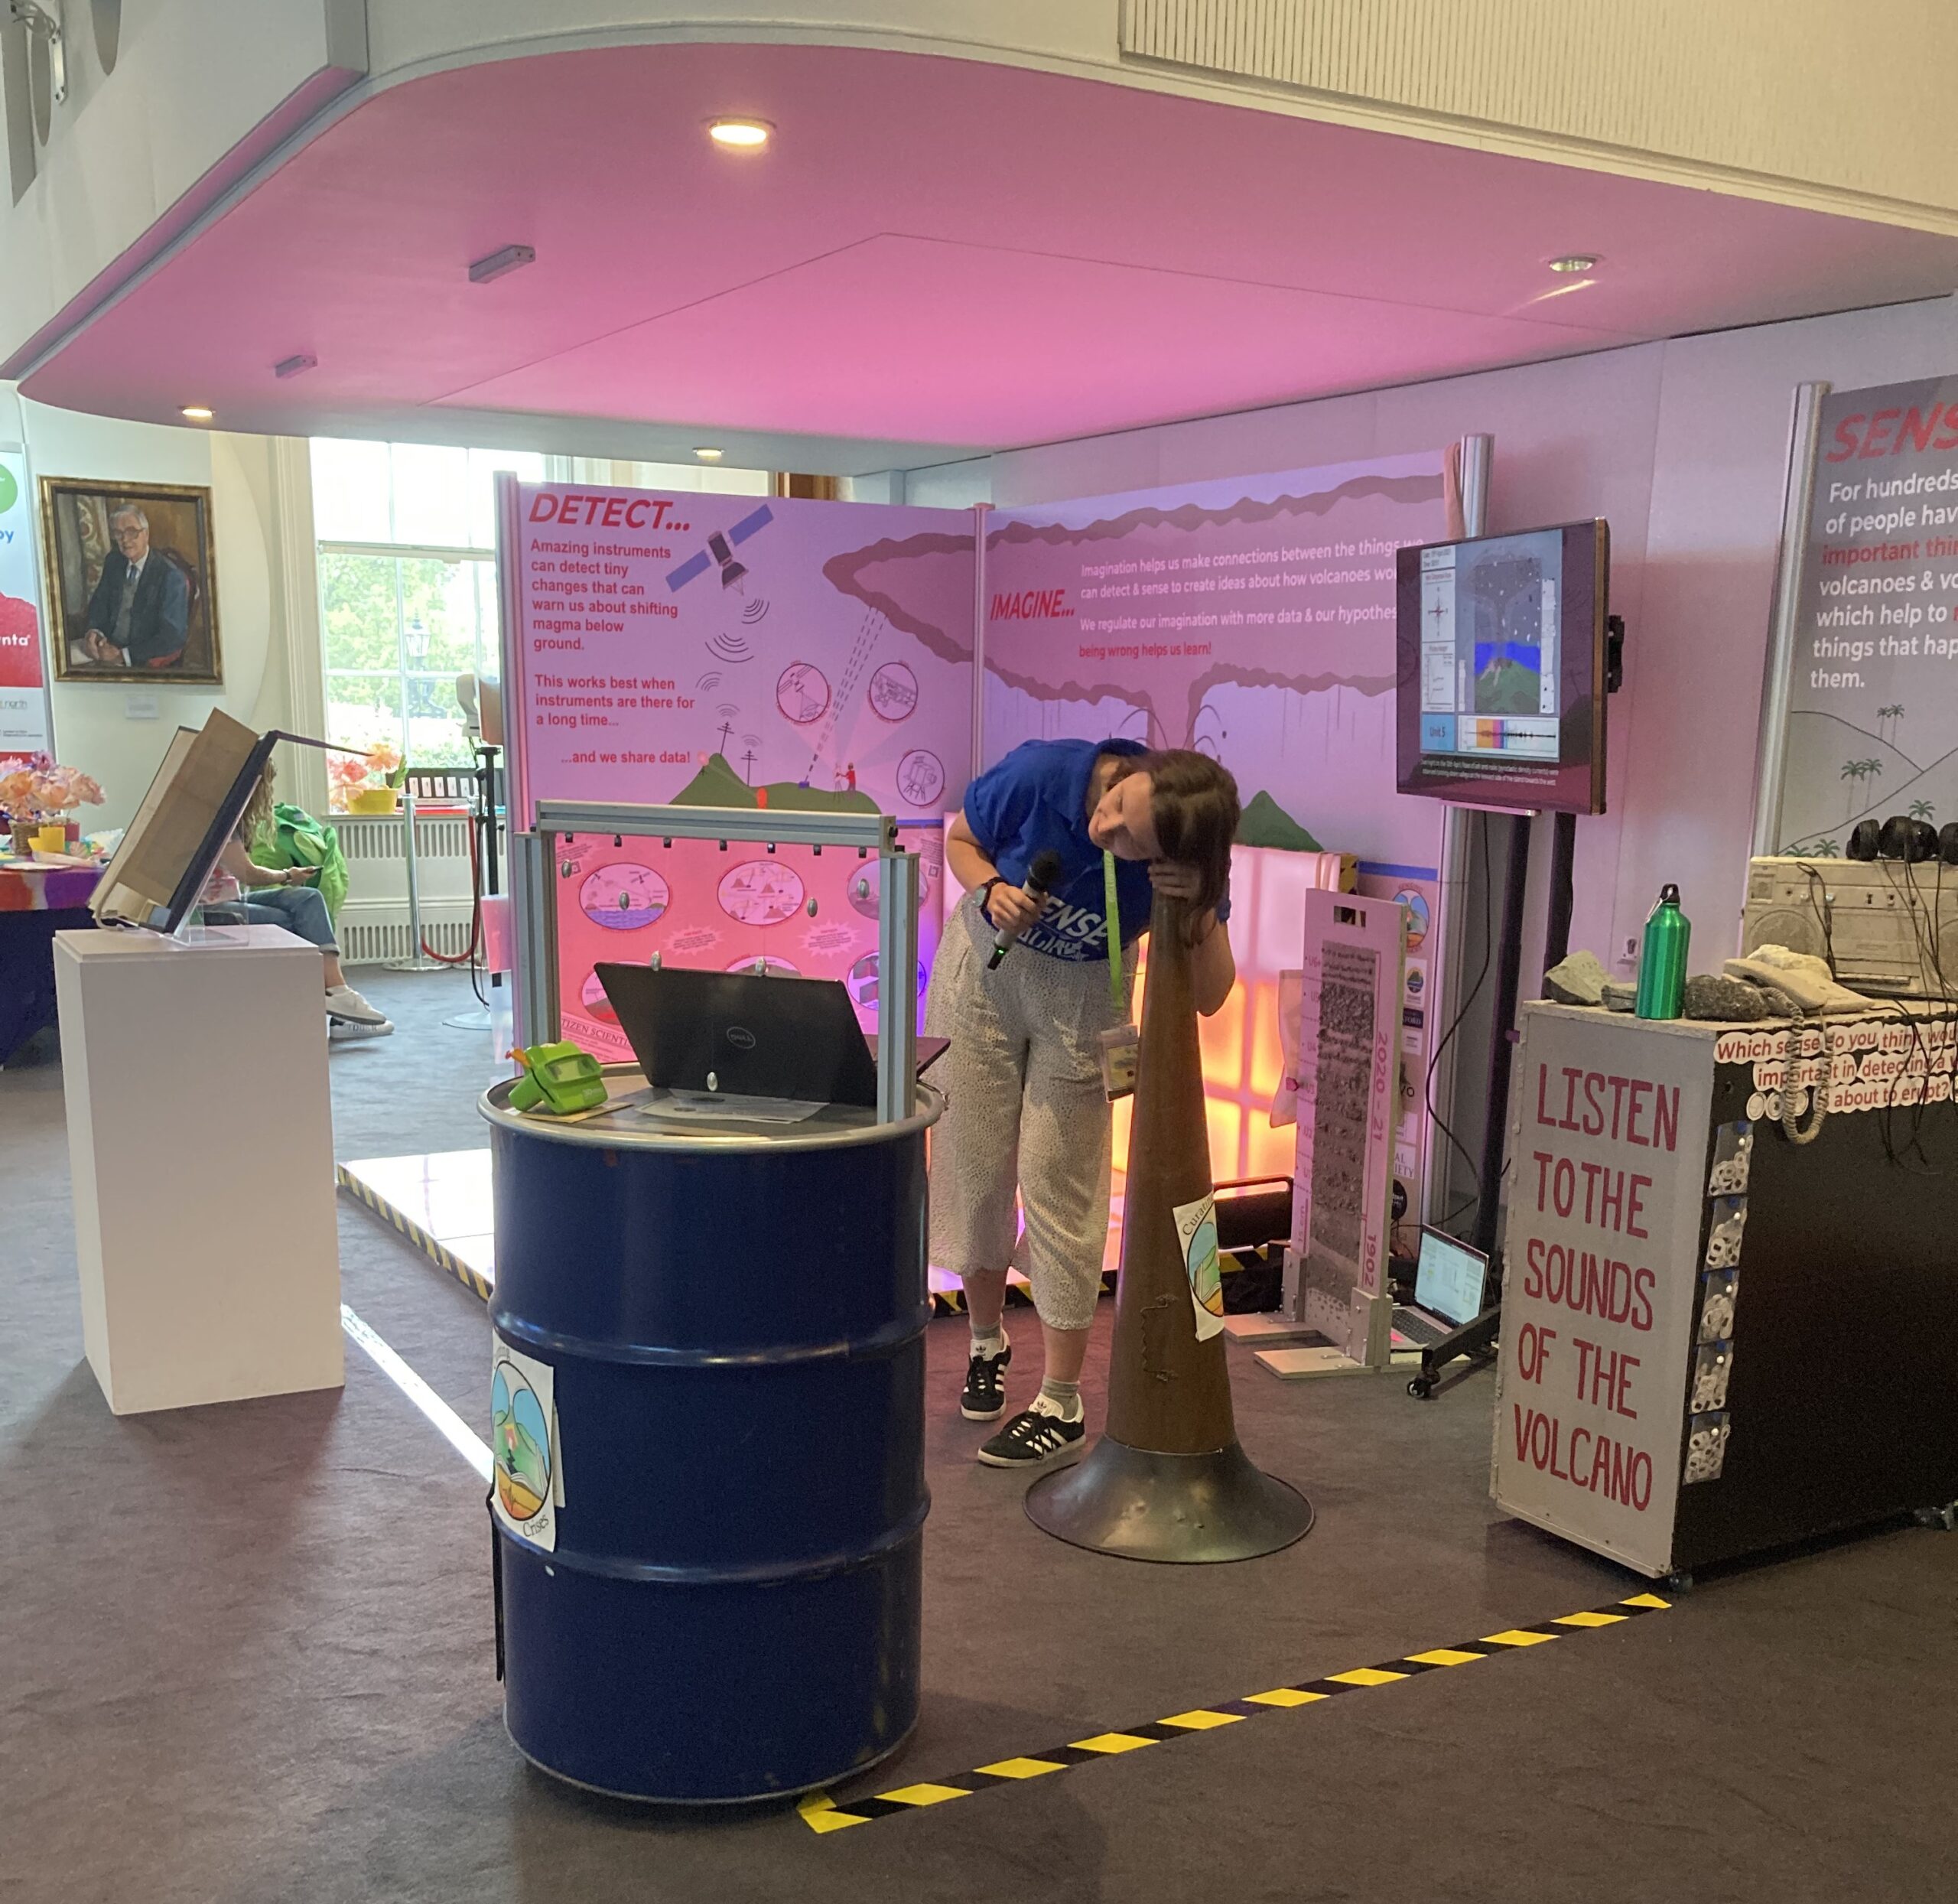
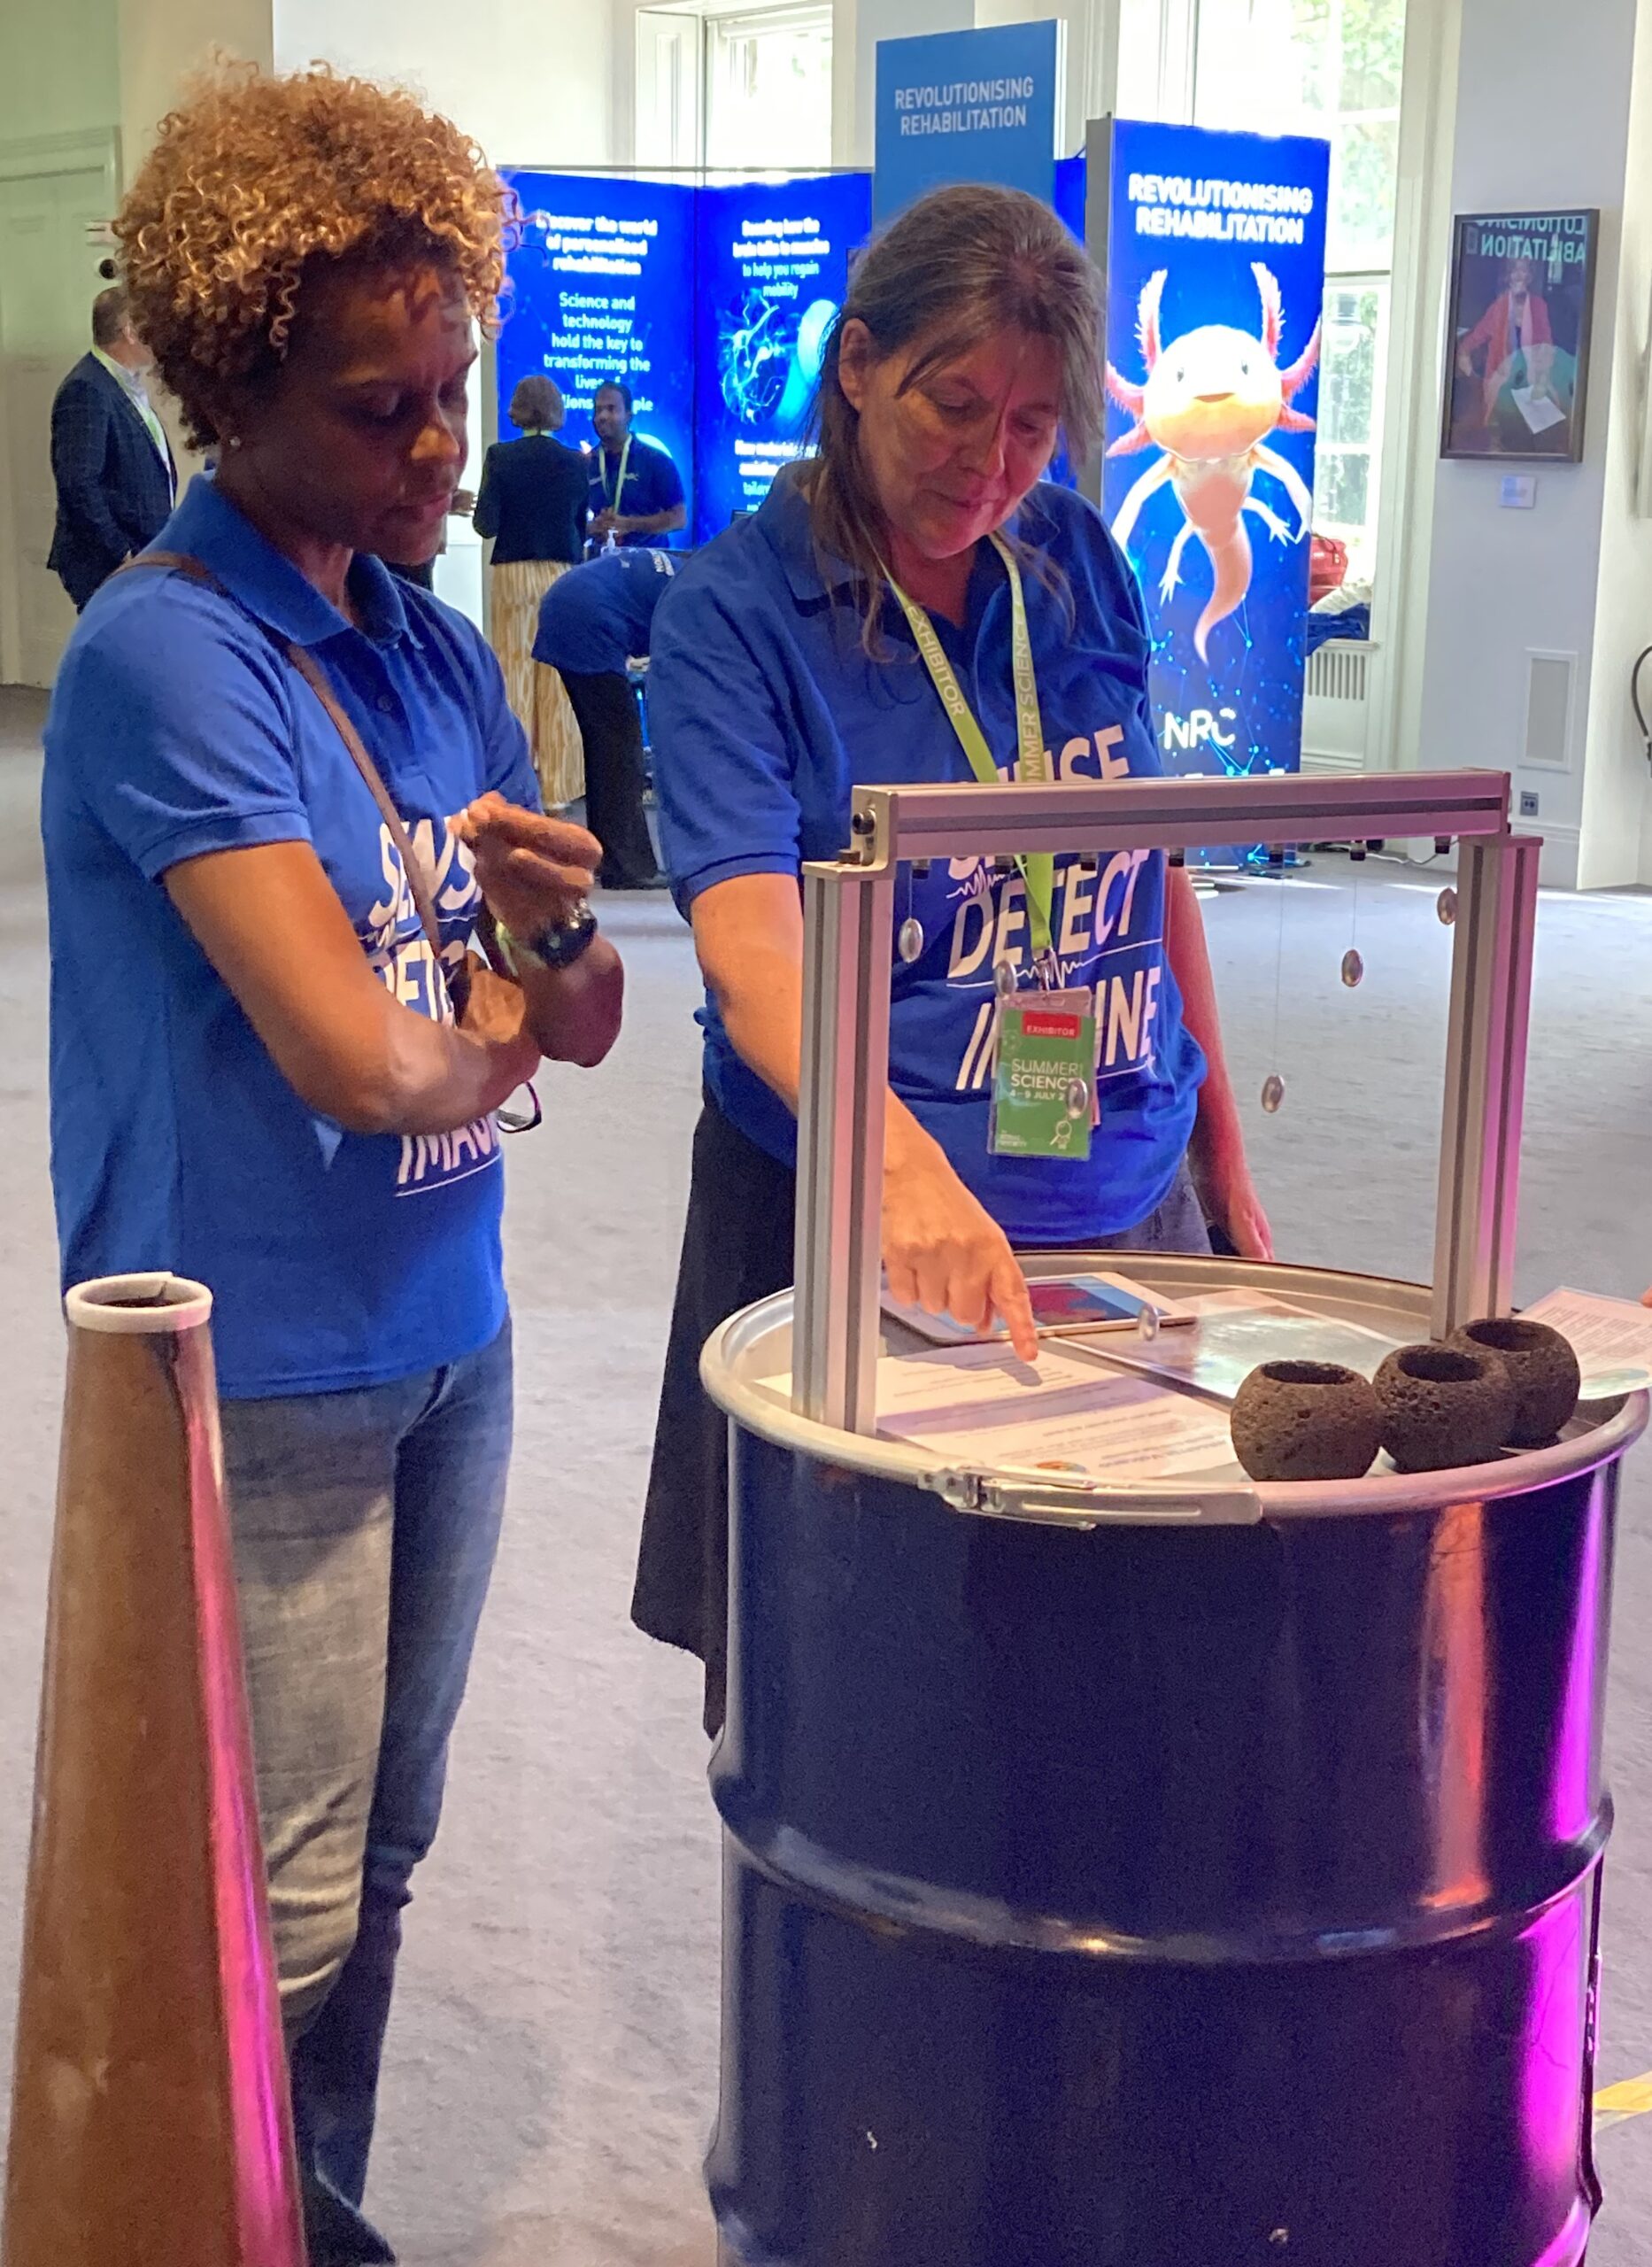
Beyond his research excellence, Professor Pyle has demonstrated exceptional commitment to outreach and public engagement with science. He curated the ‘Volcanoes’ exhibition at the Bodleian Library, Oxford in 2017, authored two books, and helped lead two Royal Society Summer Science exhibits: ‘Fast and Furious’ in 2010 and ‘Sensing Volcanoes’ in 2023. His contributions to the field were recognised with the prestigious Murchison Medal of the Geological Society of London in 2024.
A Celebration of Earth Sciences Excellence
The election of both Professor Edmonds and Professor Pyle as Fellows of the Royal Society represents a tremendous achievement for Earth sciences, highlighting the vital importance of understanding our planet’s dynamic processes. Their complementary expertise demonstrates the breadth and depth of excellence in volcanic research.
We extend our warmest congratulations to Professor Marie Edmonds FRS and Professor David Pyle FRS on this prestigious honour!