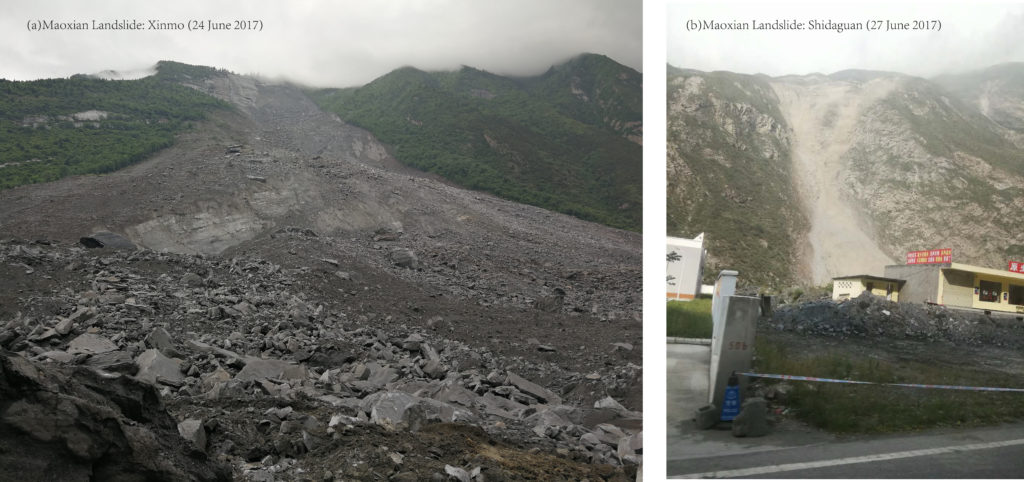
At about 5:38am local time on 24 June 2017 (21:38 on 23 June 2017 UTC), a massive landslide struck Xinmo Village, Maoxian County, Sichuan Province in China. Sichuan province is prone to earthquakes, including the 2008 Mw 7.9 Wenchuan earthquake that killed over 70,000 people, as well as the 1933 Mw 7.3 Diexi earthquake with a death toll of up to 9300.
Authorities have confirmed that the Maoxian landslide was triggered by heavy rain. The Maoxian landslide swept 64 homes in Xinmo village, blocking a 2km section of river and burying 1,600 meters of road. The collapsed rubble was estimated to be about eight million cubic meters (Figure 1a). Three days later (on 27 June 2017), a second landslide hit Xinmo Village; almost in the same time, another landslide occurred in Shidaguan Town, 20km away from Xinmo Village (Figure 1b).
As part of the ESA’s Copernicus Program, the Sentinel-1 mission comprises a constellation of two polar-orbiting satellites, operating day and night performing C-band synthetic aperture radar imaging in all-weather conditions. Sentinel-1 images acquired before and after events such as landslides, earthquakes or volcanoes offer information on the extent and surface displacements of affected areas, which can be used for damage and future hazard assessment.
A joint team from Newcastle University (UK), Chengdu University of Technology, Tongji University, China Academy of Space Technology and Wuhan University (China) have been racing against time to respond these two events by combining ESA’s Sentinel-1, Chinese Gaofen-2/3 with field observations.
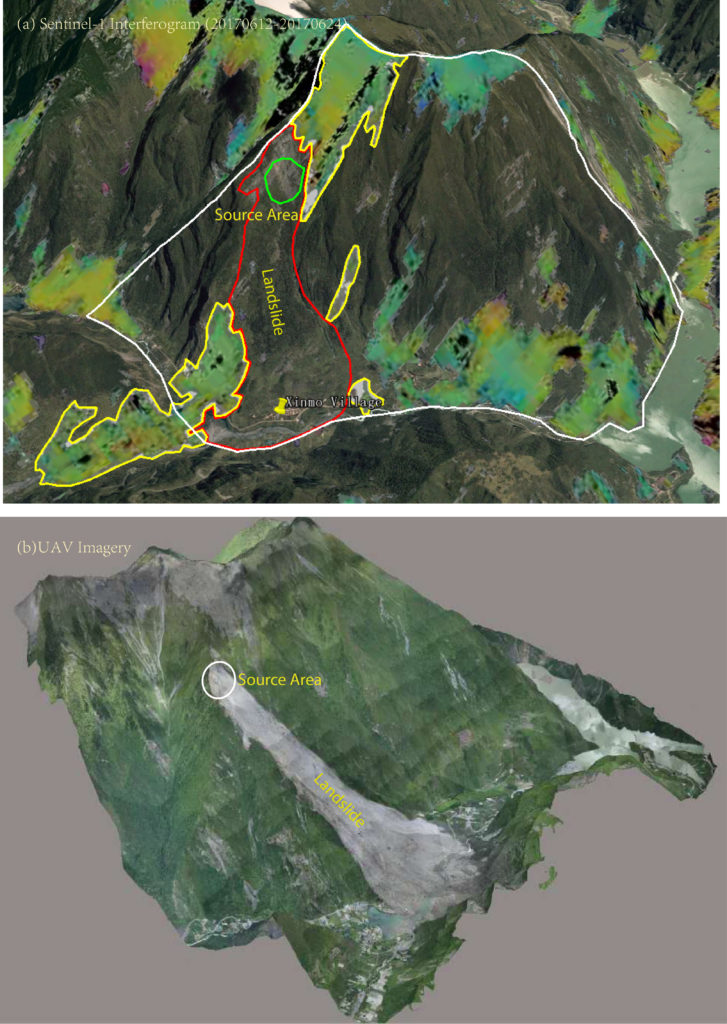
“Sentinel-1 acquired a post-event image thirteen and half hours after the Xinmo event, and provided us the first interferogram for the Xinmo landslide.” said Professor Zhenhong Li, Professor of Imaging Geodesy at Newcastle University, “This first Sentinel-1 interferogram, together with its corresponding coherence and amplitude maps, not only helped us identify the source area of this massive landslide, but also assisted with mapping the landslide boundary (Figure 2).”
“More importantly, through the analysis of the archived Sentinel-1 data, we found that pre-event movements exhibited in the source area during the period from 14 May to 19 June 2017 for the Xinmo event.”
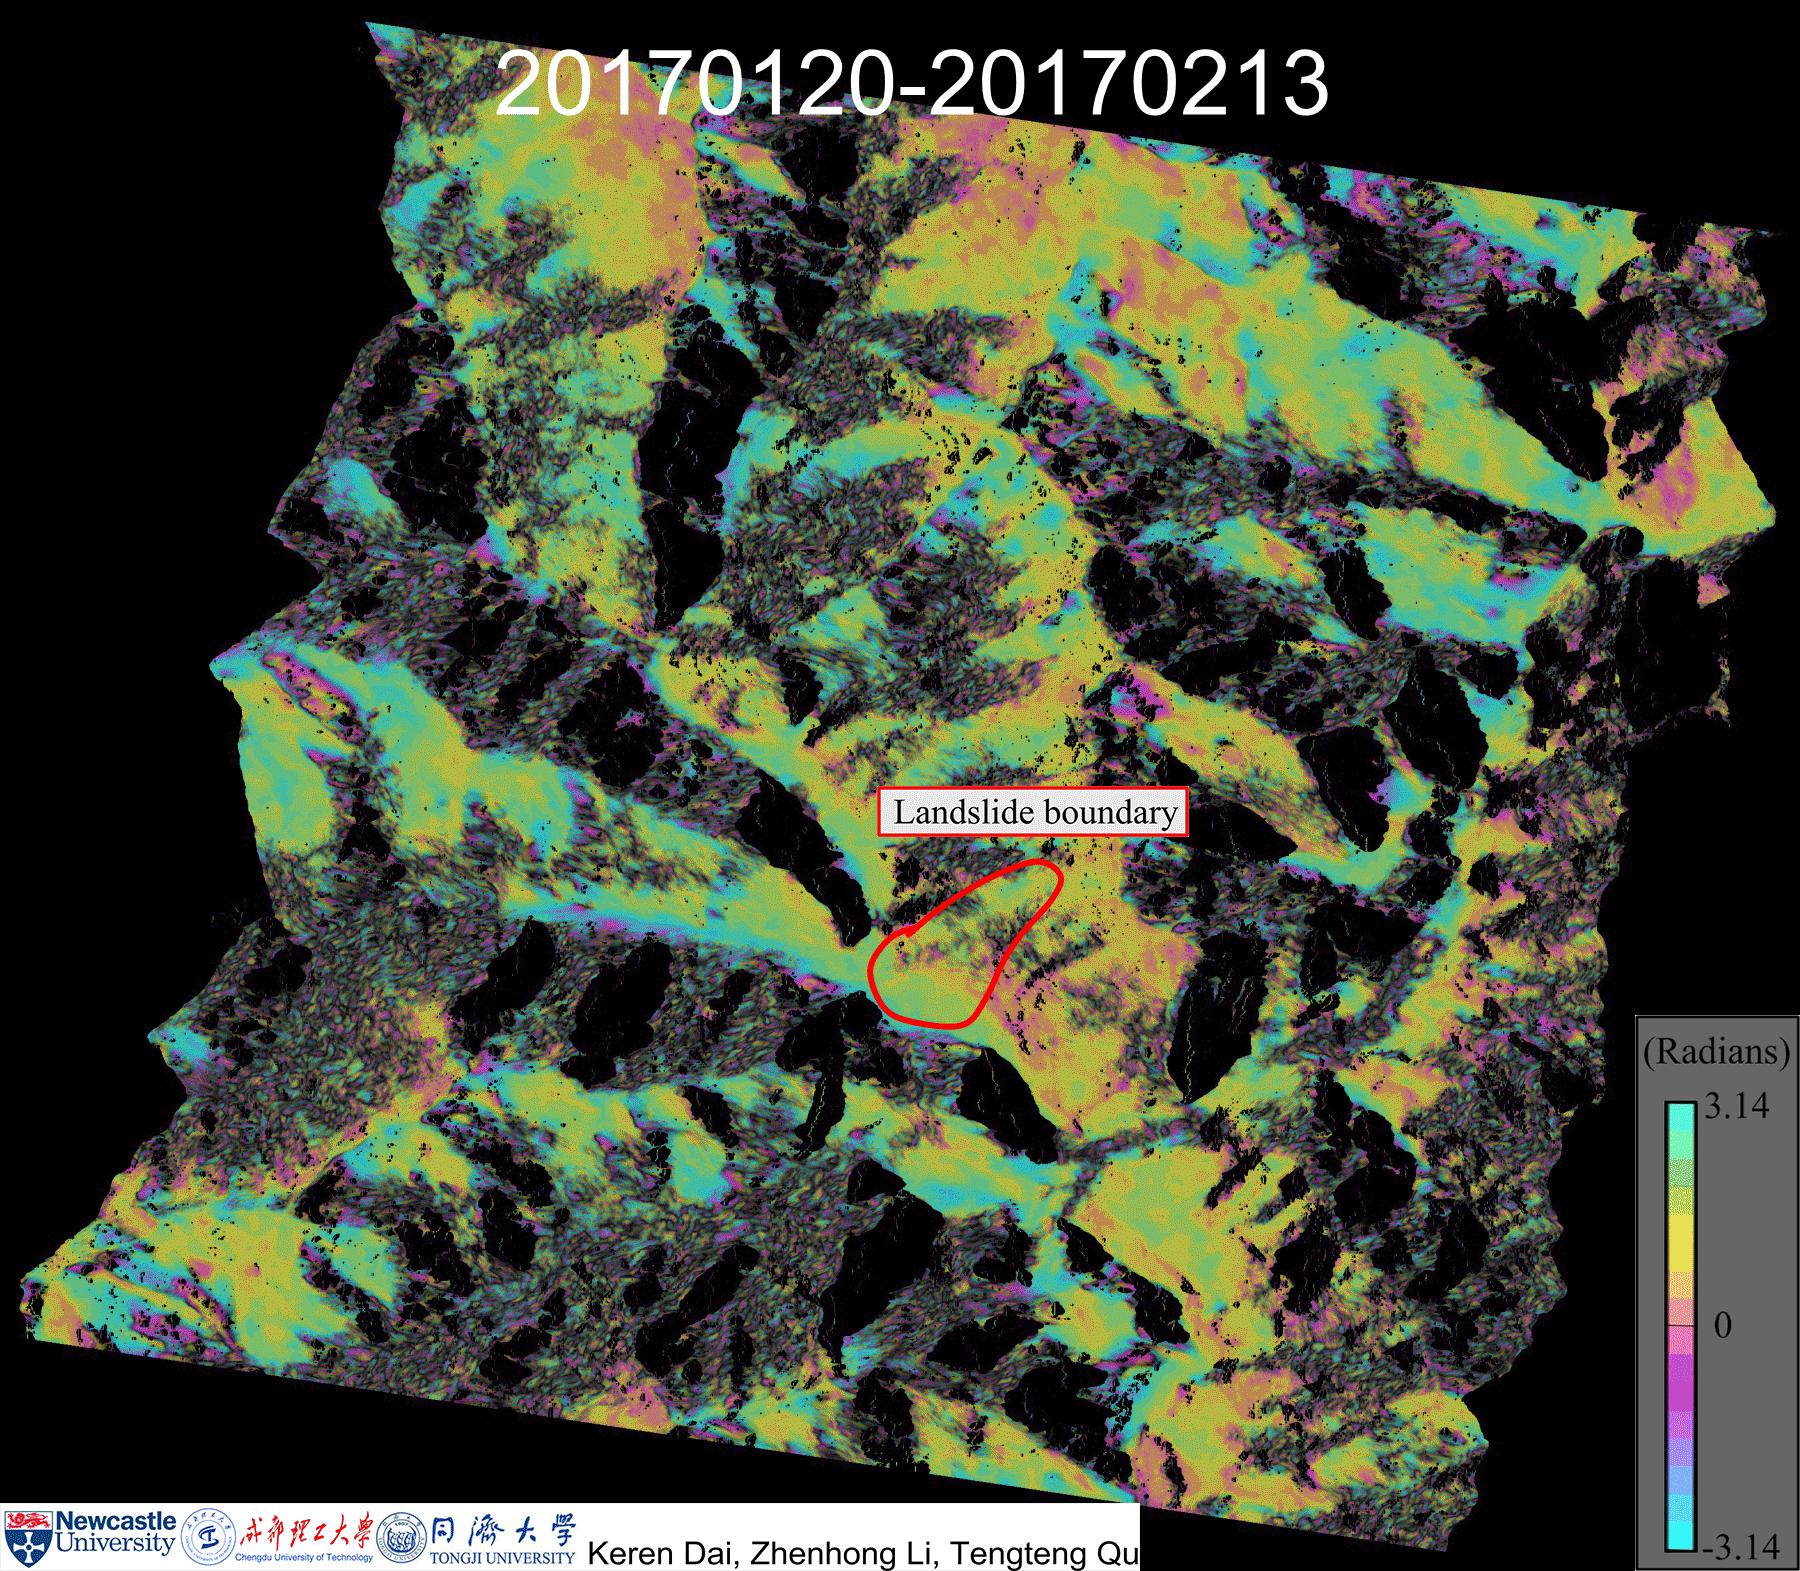
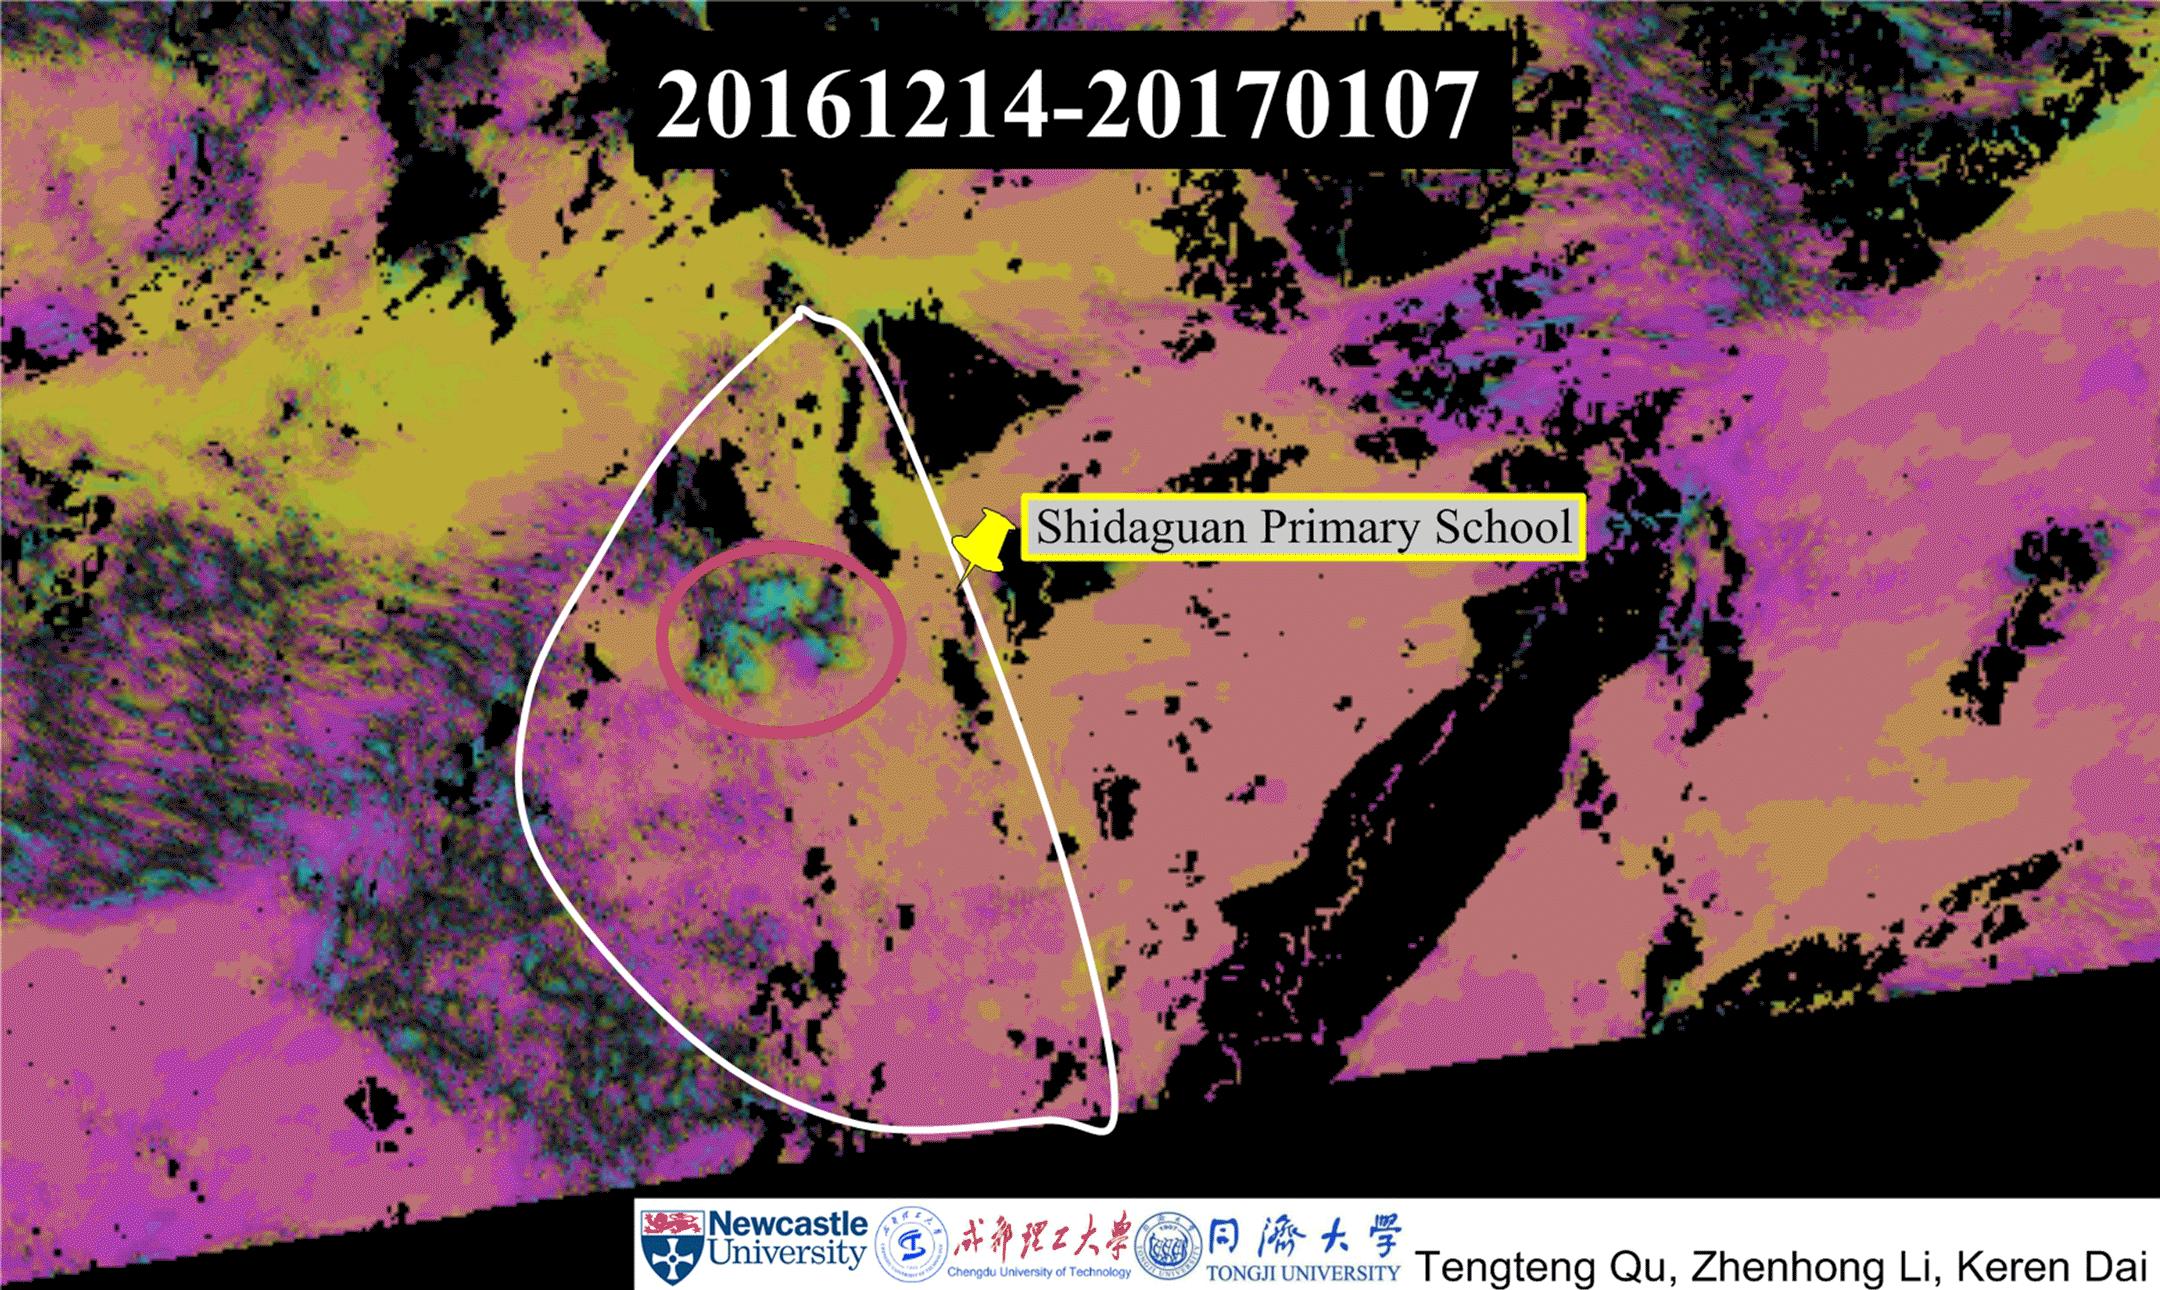
Pre-event signals are even clearer for the Shidaguan landslide, suggesting it had been sliding for a while.
“It is well known that landslides are hard to predict” said Professor Qiang Xu, Geologist with Chengdu University of Technology, “This study convincingly demonstrates that InSAR can be used to detect and map active landslides, which is a great achievement.”
After presenting the joint research findings in the Dragon-4 symposium at Copenhagen on 27 June 2017, Professor Deren Li, Academician of Chinese Academy of Sciences (CAS) and Chinese Academy of Engineering (CAE) at Wuhan University concluded, “This joint effort suggests that landslide Early Warning System (EWS) might be encouraging. There are a range of factors we should consider for EWS, such as real time, automatic, spatial and temporal resolutions, and data uncertainty.”