Multiple techniques shed light on the August 2014 Murmuri, Iran earthquake sequence

Multiple techniques shed light on the August 2014 Murmuri, Iran earthquake sequence

COMET researchers have unravelled a complex seismic sequence using a combination of techniques, explaining not only the earthquake sequence itself but also the formation of the mountain range where it occurred.

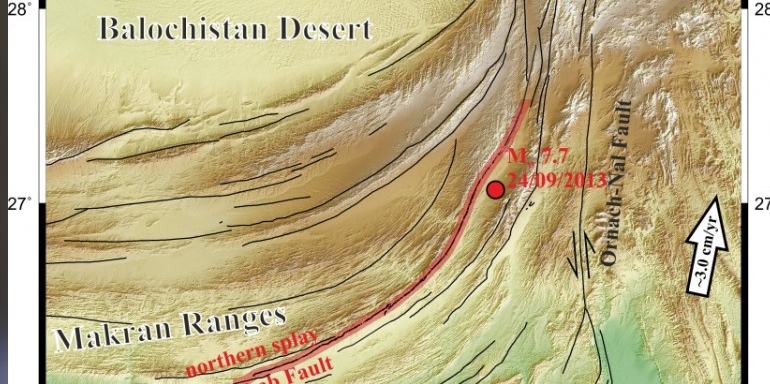
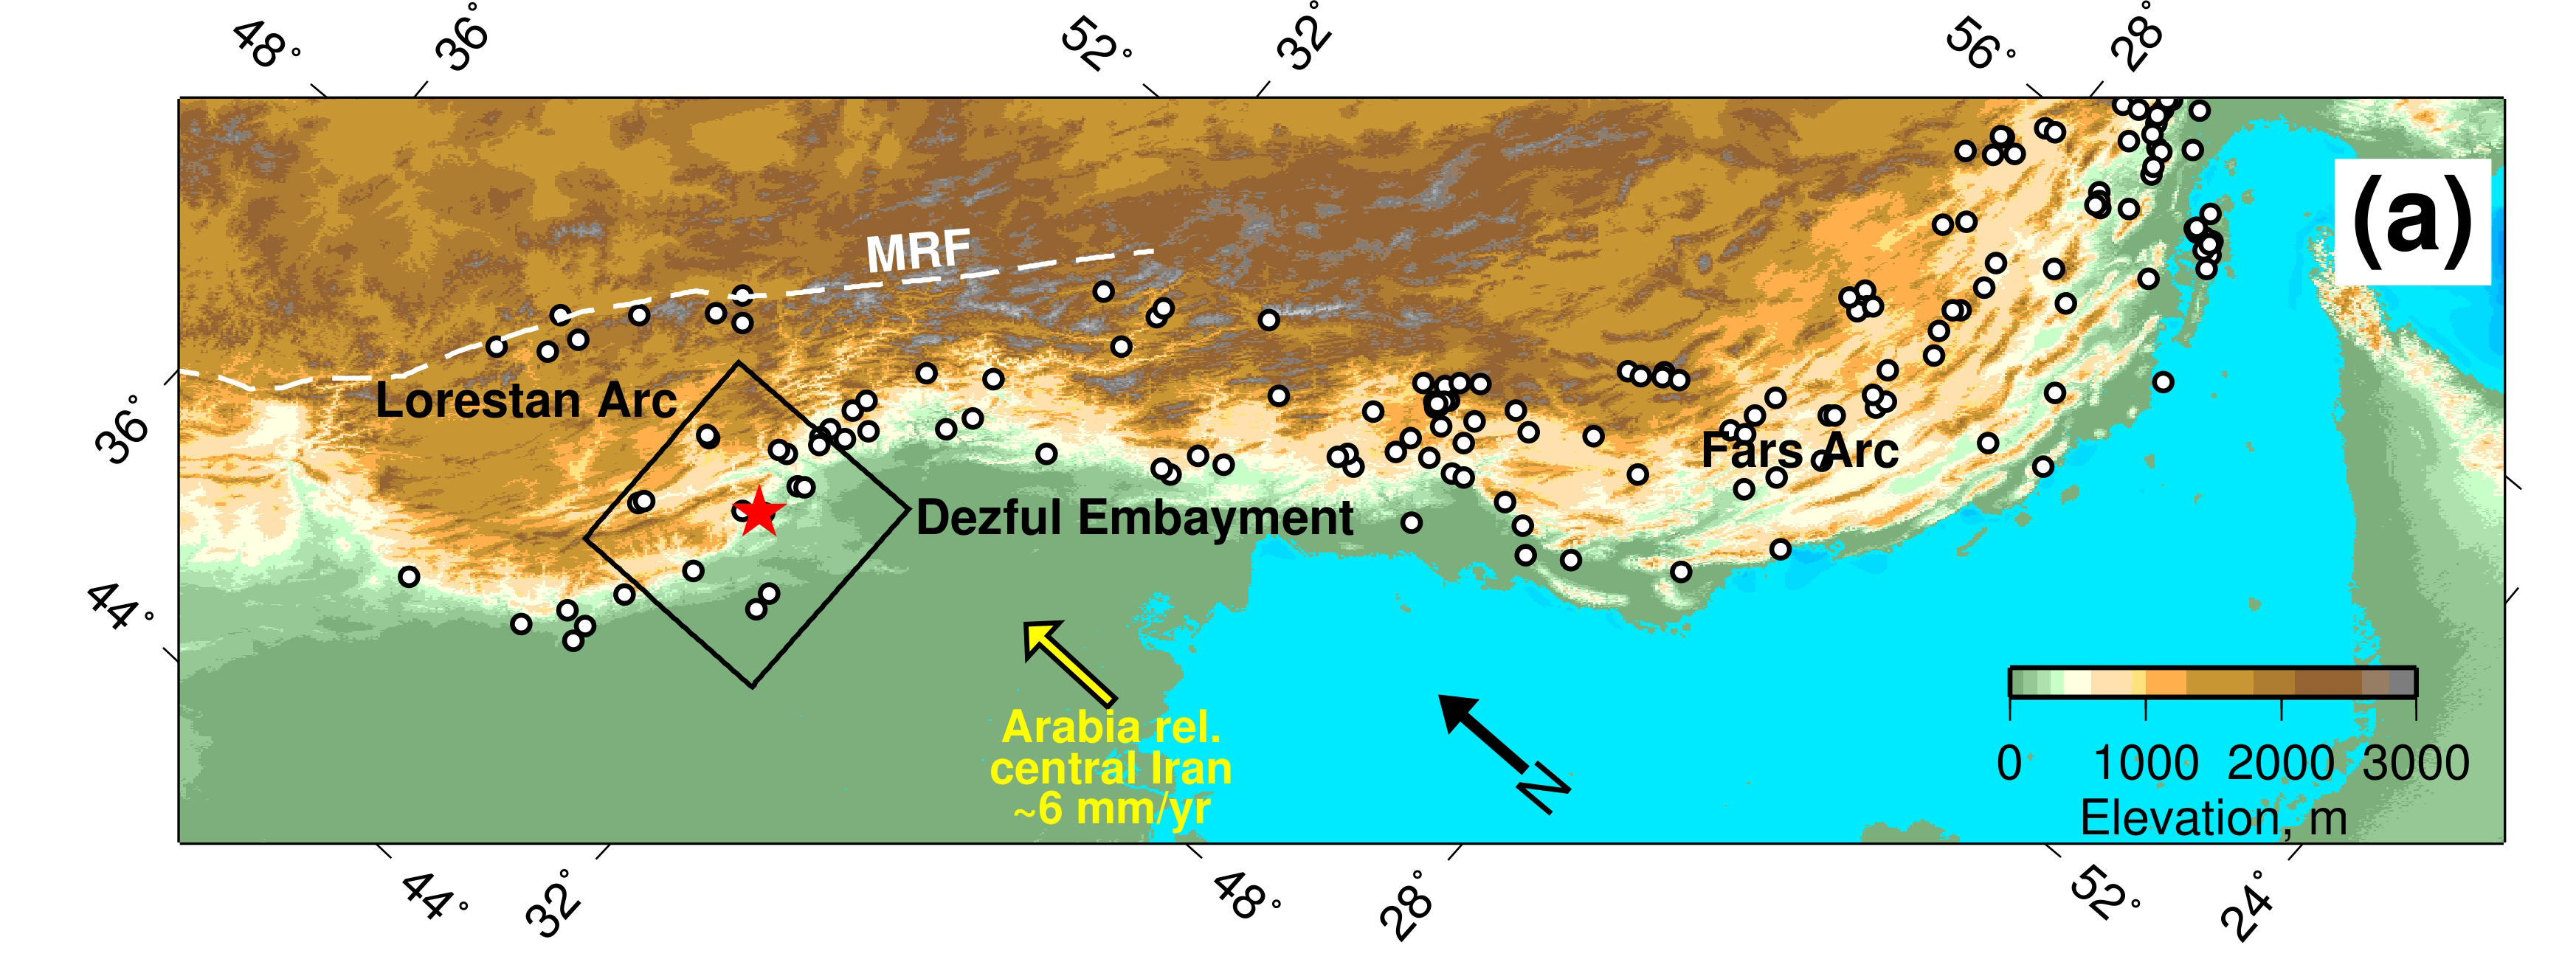
On August 18 2014, an Mw 6.2 earthquake struck Murmuri, near Dehloran in the Zagros Mountains of South West Iran (Figure 1), and was followed by five aftershocks of Mw of at least 5.4.  The largest of these was a Mw 6.0 aftershock which took place 16 hours after the main event.

These were the first large seismic events in the region since important developments in satellite Earth Observation (EO) have allowed us to study earthquakes in unprecedented detail, providing the potential to combine  a range of satellite-based and seismological approaches.

The study team, which included COMET scientists from Cambridge and Oxford along with colleagues from Iran, Colorado, and Canada, saw this as an opportunity to shed light not only on the Murmuri earthquake but also on how the Zagros Mountains themselves are evolving.

Figure 1 below shows the distribution of earthquakes in the region along with the 2014 Murmuri event.

Figure 1: Earthquakes and topography of the Zagros Mountains. White circles show events of magnitude 5.0 and larger (Nissen et al., 2011). The red star shows the Murmuri mainshock.

The depth of the earthquake-generating thrust faults in the Zagros Mountains has been the subject of debate for some time.  Previous studies have disagreed on whether the faults break a thick sequence of sedimentary layers, or are confined to the underlying crystalline rocks.

Importantly, rather than using a single technique, the team combined satellite-based EO techniques with studies of the seismic waves generated by the earthquake and aftershocks.  The first step was to identify their locations, which was crucial to understanding the relationship between the ground motions detected by InSAR and the fault planes that caused the earthquakes.  They then used the results to generate models of the faults.

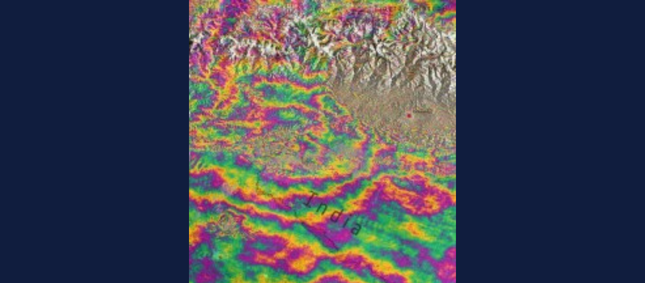
Modelling the seismic waves showed that all except one of the events were caused by thrust faults.  The smooth signals in the InSAR interferograms meanwhile showed that the faulting which led to the earthquake was buried deep under the surface.

Figure 2: Interferograms of the 18 August 2014 earthquake.  Each interferogram is labelled with the dates of the two SAR acquisitions in the format YYYYMMDD, and the background shading is the topography.

The next question was whether the earthquakes had been caused by a single or multiple faults.  The interferograms showed distinct lobes extending to the east and southeast of the main affected area, suggesting that the displacements on the surface were caused by two if not three separate faults.

COMET’s Alex Copley, from the Department of Earth Sciences at the University of Cambridge, explained: “ We found that a single-fault model couldn’t reproduce the deformation patterns shown by the interferograms, so we investigated by applying multiple-fault models instead.”

The team modelled the faults to establish characteristics including their direction, length and angle.  When they used the interferograms alone there were a wide range of different fault parameters that could produce models that matched the data, but by including the seismic data the team could narrow down these characteristics.

Dr Copley added: “The only way we managed to work out what actually happened was by using seismological techniques, and then using these results  to interpret the satellite measurements.”

The results showed that the 18 August 2014 event involved significant slip on two planes, which produced a complex displacement pattern in the InSAR, and that there were two separate events big enough to produce surface deformation signals, hence the two lobes on the interferograms.

It also became clear that most if not all of the faulting took place in the sedimentary layers rather than the igneous rocks below, at depths of 3-9km.  The faults were also found to be longer than they were deep, which is relatively unusual – most faults tend to be more or less equal in length and depth.  This could be because changes in the mechanical properties of the rocks below stop the faults from extending any deeper.

As well as explaining the events at Murmuri, the results throw light on the large scale tectonics of the Zagros Mountains, showing which combination of tectonic forces and material properties of the rocks can give rise to the shape and deformation pattern of the mountain range.

Dr Copley summarised: “If we had used seismology or satellite measurements alone we would have failed to learn much that was new about this earthquake sequence.  Instead, our approach allowed us to shed light not only on the formation of the Zagros, but also how similar fold-thrust belts form across the globe.”

The full paper is: Copley, A., Karasozen, E., Oveisi, B., Elliott, J.R., Samsonov, S., Nissen, E.  Seismogenic faulting of the sedimentary sequence and laterally-variable material properties in the Zagros Mountains (Iran) revealed by the August 2014 Murmuri (E. Dehloran) earthquake sequence, Geophysical Journal International, 2015 doi: 10.1093/gji/ggv365

Sentinel-1A’s TOPS explains the 2014-15 Fogo eruption

COMET researchers have used the European Space Agency’s Sentinel-1A satellite to shed light on the 2014-15 eruption at Fogo, the most active volcano in the Cape Verde archipelago.

Their paperpublished in Geophysical Research Letters, investigates the eruption using Sentinel-1A’s new radar acquisition mode, Terrain Observation by Progressive Scans (TOPS).

Fogo has erupted at least 26 times in the last 500 years, and this particular event lasted 81 days from November 2014 to February 2015.  It had devastating consequences for the island. Fast lava flows destroyed the villages of Portela and Bangaeria in early December 2014.

As the satellite had only been operating for a few weeks when the eruption began, this is the first study to use Sentinel-1A TOPS to investigate surface deformation associated with volcanic activity.

Lead author Dr Pablo J. González, from the University of Leeds, explained: “the study has given us a real insight into the inner workings of Fogo volcano.  It also shows the potential of Sentinel-1’s TOPS mode for monitoring volcanic activity in the future acheter du viagra.”

Up until recently, the volcano had mostly been monitored by a GPS network with limited spatial coverage.  In comparison, the wide area and high spatial resolution of Sentinel-1A’s satellite images allowed the team, which included researchers from Norway, The Netherlands and Canada, to monitor ground deformation across Fogo.

Using the TOPS data, they found that during the eruption the ground surface had changed in a “butterfly” shape, characteristic for a dike intrusion (where the magma intrudes into a fissure, shouldering aside other the existing layers of rock).

Sentinel-1A ascending interferogram spanning the onset of the2014-2015 Fogo eruption (3 – 27 November 2014). Each colour fringe represents ~3 cm of ground displacement.

Models created to reproduce the observed data then showed that first of all the magma moved rapidly from depths of more than ten kilometres below the volcano’s summit.  It then moved along the dike to feed the eruption at a fissure on the southwestern flank of the volcano’s summit cone, rather than from its top.

This was backed up by the satellite data showing a lack of deformation across the whole island during the eruption, which would have suggested that it was instead being fed by an inflating/deflating magma reservoir directly beneath.

The findings will now set the direction for further research aimed at understanding the pattern of eruptions on the island, as well as assessing the stability of the entire volcanic structure.

Dr Marco Bagnardi, COMET researcher, and also co-author in this paper, added: “Our results not only show the importance of near-real time ground deformation monitoring at Fogo, they also demonstrate the potential of Sentinel-1A’s TOPS mode for monitoring geohazards more widely.”

The full paper, The 2014-2015 eruption of Fogo volcano: geodetic modelling of Sentinel-1 TOPS interferometry, is available now in Geophysical Research Letters

Icelandic volcano’s toxic gas is treble that of Europe’s industry

A huge volcanic eruption in Iceland emitted on average three times as much of a toxic gas as all European industry combined, a new study has revealed.

Bárðarbunga eruption. Credit: John Stevenson.

Discharge of lava from the eruption at Bárðarbunga volcano, starting in August 2014, released a huge mass – up to 120,000 tonnes per day – of sulphur dioxide gas.  You can watch a video of the eruption here.

These emissions can cause acid rain and respiratory problems.

Researchers hope that their study, published by the Journal of Geophysical Research, will aid understanding of how such eruptions can affect air quality in the UK.

Dr Anja Schmidt, a COMET Associate from the School of Earth and Environment at the University of Leeds, who led the study, said: “The eruption discharged lava at a rate of more than 200 cubic metres per second, which is equivalent to filling five Olympic-sized swimming pools in a minute. Six months later, when the eruption ended, it had produced enough lava to cover an area the size of Manhattan.

“In the study, we were concerned with the quantity of sulphur dioxide emissions, with numbers that are equally astonishing: in the beginning, the eruption emitted about eight times more sulphur dioxide per day than is emitted from all man-made sources in Europe per day.”

The eruption last year was the biggest in Iceland for more than 200 years. It released a river of lava across northern Iceland, and lasted for six months.

The team, which also included COMET members Tamsin Mather, Elisa Carboni and Don Grainger from the University of Oxford, used data from satellite sensors to map sulphur dioxide pollution from the eruption. These were reproduced by computer simulations of the spreading gas cloud.

As well as being given off by volcanoes, sulphur dioxide is also produced by burning fossil fuels and industrial processes such as smelting. Man-made sulphur dioxide production has been falling since 1990, and was recorded at 12,000 tonnes per day in 2010.

Further information

The research was funded by the Natural Environment Research Council (NERC) and the Royal Society of Edinburgh.

The study, ‘Satellite detection, long-range transport and air quality impacts of volcanic sulfur dioxide from the 2014-2015 flood lava eruption at Bárðarbunga (Iceland)’, is published by the Journal of Geophysical Research.

Remote sensing of cross-border quakes

Post by Richard Walters, Research Fellow at the University of Leeds with COMET and the Earthquakes without Frontiers project ([email protected])

Active faults and the devastating earthquakes they can trigger do not respect political borders. Whilst the recent earthquakes in Nepal did most damage to the mountain kingdom itself, hundreds of people were also killed or injured in neighbouring China, India and Bangladesh.

The region’s history tells a similar story – the three countries’ earthquake records over the last 500 years are intertwined by shared proximity to the Himalayan mountain belt and its underlying megathrust fault.

Ways of improving resilience to earthquake hazard also need to transcend political boundaries, bringing together scientists and policymakers from the affected countries to share knowledge, experience and ideas.

This principle has led to the Earthquakes without Frontiers (EwF) partnership – a diverse group of natural and social scientists from around the UK. Led by James Jackson of both COMET and the University of Cambridge, EwF is a 5-year initiative funded by NERC and ESRC (the Natural Environment and Economic and Social Research Councils) under the Improving Resilience to Natural Hazards programme.

As well as COMET, the partnership includes researchers from Cambridge, Durham, Hull, Leeds, Northumbria and Oxford Universities, the British Geological Survey, the Overseas Development Institute and Durham’s Institute of Hazard, Risk and Resilience.

The project focuses on three broad regions – China, the Himalayan mountain front (Nepal and Northern India) and Central Asia (Kazakhstan and Kyrgyzstan) – with the key objective of furthering knowledge on earthquakes and landslides in the continental interiors.

Much of this involves using remotely sensed data which complements the project’s cross-border approach. EwF scientists use digital topography and multispectral and optical imagery to research landslide hazard and map active faults, alongside satellite radar to measure the warping of the Earth’s crust and steady interseismic motions as faults build up stress before the next seismic event.

All of this contributes to a wider programme of social and natural scientific research with scientists in the partner countries, as well as being used to run workshops and training events for young international scientists.

Crucially, this knowledge exchange extends to countries dealing with similar hazards – the same types of fault that threaten vast regions in China also cause earthquakes in Italy, and lessons learnt about Iranian faults can inform work on hazard in Kazakhstan and vice versa.  As such, EwF brings together scientists from many countries to share knowledge and experience across an even wider network, culminating in the annual EwF partnership meetings, the most recent of which was held in Kathmandu in April 2015.

When a huge Mw7.8 earthquake struck Nepal on the 25th April, it came as a double blow to all within EwF. Nepal is not only one of our focus areas, but many of the UK team also had been in Kathmandu just one week before the earthquake, working and living alongside Nepali colleagues and friends.

The International Charter for Space and Major Disasters was invoked just 3 hours after the earthquake, and over the following few days, space agencies hurriedly tasked their satellites to acquire new imagery over Nepal. We all felt strongly that we should put our combined experience to good use in the immediate aftermath of the Nepal earthquake, and dashed to obtain satellite imagery of the area.  In the weeks since we have been working to analyse this imagery in order to aid both disaster relief efforts and hazard re-evaluation.

Figure 1: Satellite radar interferogram of the 25 April 2015 Mw7.8 Nepal Earthquake. The coloured fringes represent contours of ground motion towards the satellite, at intervals of 8.5 cm. Image credit: Pablo Gonzalez, University of Leeds, EwF, LiCS; SAR data provided by the European Space Agency

EwF researchers, along with colleagues at the University of Leeds, used data from the European Space Agency’s Sentinel-1A satellite to measure how the ground was permanently warped by the earthquake.  This was greatly assisted by COMET’s new automated processing facility, designed to cope with the vast amount of data from the Sentinel-1 satellites, which helped to produce some of the first radar interferograms of the Nepal earthquake.  These mapped how the ground was warped along a 170 km stretch of the fault, moving by up to ~1.4 m near Kathmandu.

We are now modelling the data to understand how the fault slipped at depth, establish the relationship with the large Mw 7.3 aftershock on the 12th May, and gauge how these events may have stressed the surrounding regions, making them more likely to fail in future.

At the same time, EwF scientists at Durham University and the British Geological Survey have been using high-resolution optical and multispectral imagery to map landslides in the region.  We have identified around 3,600 landslides that were either triggered or reactivated by the earthquake, using the maps to show where rivers are likely to be dammed and roads blocked. This has also highlighted the need to plan for the monsoon season which may reactivate or trigger even more deadly landslides.

Figure 2: Landslide map. Colour scale shows landslide intensity, with blue ~ 1 landslide/km2 and red ~29 landslides/km2. ( http://ewf.nerc.ac.uk/2015/05/28/nepal-updated-28-may-landslide-inventory-following-25-april-nepal-earthquake/) Image credit: University of Durham, EwF, BGS.  Satellite data have been provided via the International Charter for Space and Major Disasters and freely available online viewers: WorldView @ Digital Globe; USGS LandSat8; Bhuvan RS2; Astrium Imagery; Google Crisis.  Vector data: OSM. Digital Elevation Model: ASTER

Over the coming months, EwF researchers will continue to work on these topics as well as the many more questions raised by the Nepal earthquake. We hope that the lessons learned from this terrible event will bring us one step closer to improving resilience to future earthquakes, not just for Nepal and the countries across its borders, but for all earthquake-prone countries.

This is an abridged version of an article that appears in the current newsletter of the Geological Remote Sensing Group

Measuring the refractive index of volcanic ash – new paper in Journal of Geophysical Research

COMET scientists’ Tamsin Mather, David Pyle and Roy Grainger have a new paper in the Journal of Geophysical Research on the detection and quantification of volcanic ash.

Credit:BGS

This is extremely important to the aviation industry, civil defence organisations and those in peril from volcanic ash fall, using remote sensing techniques to monitor volcanic clouds and return information on their properties.

The paper presents the complex refractive index of volcanic ash at 450.0 nm, 546.7 nm and 650.0 nm from eruptions of Aso (Japan), Grímsvötn (Iceland), Chaitén (Chile), Etna (Italy), Eyjafjallajökull (Iceland), Tongariro (New Zealand), Askja (Iceland), Nisyros (Greece), Okmok (Alaska), Augustine (Alaska) and Spurr (Alaska).

You can find the full paper, Measurements of the complex refractive index of volcanic ash at 450, 546.7 and 650 nm in the Journal of Geophysical Research, doi: 10.1002/2015JD023521

The 2013 Mw 7.7 Balochistan earthquake in Pakistan: Not so unusual

In 2013, a MW7.7 earthquake struck Balochistan, caused a huge surface offset and triggered a small tsunami in the Arabian Sea.

The apparently strange fault behaviour attracted the attention of scientists worldwide and discussion is still ongoing.

This an interesting case for paleoseismologists, not only because of the cascading earthquake effects, but also because of the surface rupture distribution, from which we might learn some important lessons.

COMET student Yu Zhou and his colleagues from Oxford University have published a new paper on this event, arguing that it might be not as unusual as it seems. Their research is based on the analysis of Pleiades stereo satellite imagery, which has proven to be a very useful data source.

You can read Yu’s blog on the palaeoseismicity.org website.

Dr Paola Crippa awarded L’Oréal-UNESCO For Women In Science Fellowship

COMET Research Associate Dr Paola Crippa, from the University of Newcastle, has been awarded a prestigious L’Oréal-UNESCO National For Women In Science Fellowship.

This programme encourages greater participation of women in science across the globe by promoting and rewarding outstanding female postdoctoral researchers.

One of five winners, Paola was selected by a jury of eminent scientists, chaired by Professor Pratibha Gai who was L’Oréal’s International Laureate in 2013.

Her research, focusing on particulate matter transportation and implications for human health,  integrates model results with satellite data to more accurately predict population exposure to harmful concentrations of particulate matter.

Paola will not only benefit from financial support for her research, but also a raft of career and life enhancing experiences such as media training, personal impact coaching, speaking opportunities, networking events and access to senior mentors and role models.

Congratulations Paola from all at COMET.

Professor James Jackson Awarded CBE in Queen’s Birthday Honours

Congratulations to COMET’s James Jackson who has received a CBE for his services to environmental science.

As well as being Head of the Department of Earth Sciences at Cambridge, James was one of the founding members of COMET and has been a major contributor to its ongoing success.

James has pioneered the combination of earthquake source seismology, geomorphology, space geodesy and remote sensing to examine how the continents are deforming, looking at scales that range from single earthquakes to the vast continental areas of active plate movement such as Africa, Iran and the Aegean.

He is also currently leading the Earthquakes without Frontiers (EwF) project, which brings together Earth and social scientists, science communicators, policy makers and local and regional organisations to increase resilience to earthquakes in countries across Asia.

Following the devastating earthquakes earlier this year, Following the devest the EwF team has been working with colleagues in Nepal with a view to improving resilience to future earthquakes, not just in Nepal and neighbouring countries, but also for earthquake-prone nations across the globe.

COMET Director Tim Wright said “James has had a huge influence on many of us as a scientist, teacher, and colleague, and I congratulate him on this latest award ”.

Earlier this month, James also received the Wollaston Medal, the highest award given by the Geological Society.

Well done James from all at COMET, we wish you continued success.

Notes:  Professor James Jackson is Head of the Department of Earth Sciences at the University of Cambridge and also a Fellow of the Royal Society (FRS).  You can read more about James and his work here.

COMET wins two The Geological Society awards (2015)

Two COMET scientists received prestigious awards from the Geological Society of London.

The Society, which has been recognising significant achievements in the Earth sciences since 1831, presented its Wollaston Medal (its highest award, for impacts on pure or applied geology) to COMET’s James Jackson, Professor of Active Tectonics at the University of Cambridge.

Professor Jackson’s work includes research into active tectonics in New Zealand, Iran, Turkey, Greece and Tibet, where he has made vital contributions to understanding the evolution and deformation of the continents, from individual faults to mountain belts.

Professor Geoff Wadge of the University of Reading received the Murchison Medal, awarded to geologists who have contributed significantly to ‘hard’ rock studies.  Professor Wadge was recognised for his contributions to geology and remote sensing, including research into volcanology, Caribbean tectonics, and volcanic hazards and risk assessment. The awards were presented by Geological Society President Professor David Manning at their President’s Day on 3 June 2015.

Sentinel maps Nepal earthquake 2015

On 25 April, a 7.8-magnitude earthquake struck Nepal, claiming over 8,000 lives and affecting millions of people.

Images from ESA’s Sentinel-1A satellite clearly showed the effects of the earthquake, including the maximum land deformation only 17km from Nepal’s capital, Kathmandu.  This explains the extremely high damage to the area.

Nepal earthquake April 2015.  Credit: Copernicus data (2015)/ESA/Norut/PPO.labs/COMET–ESA SEOM INSARAP study
Nepal earthquake April 2015. Credit: Copernicus data (2015)/ESA/Norut/PPO.labs/COMET–ESA SEOM INSARAP study

By combining Sentinel-1A imagery from before and after the quake, COMET scientists have been able to interpret the rainbow-coloured interference patterns in the image (known as an interferogram), and interpret them as changes on the ground.  COMET scientists have also been analysing the 12 May aftershock.  You can read more here.