An international team of scientists, led by COMET’s John Elliott, has shed new light on the earthquake that devastated Nepal in April 2015, killing more than 8,000 people.
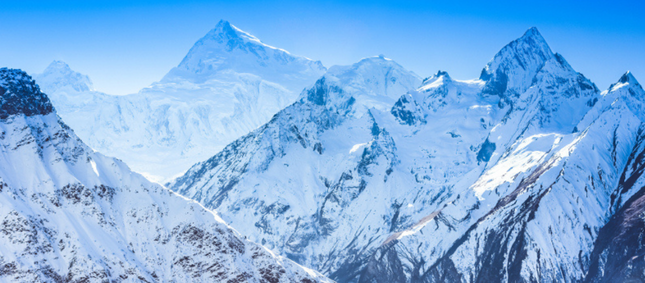
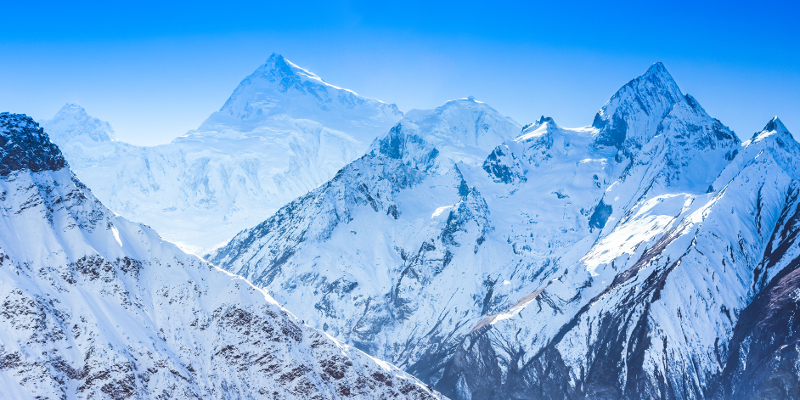
In a study published in the journal Nature Geoscience, the scientists show that a kink in the regional fault line below Nepal explains why the highest mountains in the Himalayas are seen to grow between earthquakes.
Dr Elliott explained: “We have shown that the fault beneath Nepal has a kink in it, creating a ramp 20km underground. Material is continually being pushed up this ramp, which explains why the mountains were seen to be growing in the decades before the earthquake. The earthquake itself then reversed this, dropping the mountains back down again when the pressure was released as the crust suddenly snapped in April 2015.
“Using the latest satellite technology, we have been able to precisely measure the land height changes across the entire eastern half of Nepal. The highest peaks dropped by up to 60cm in the first seconds of the earthquake.”
Mount Everest, at more than 50km east of the earthquake zone, was too far away to be affected by the subsidence in this event.
The team, which included academics from the USA and France, also demonstrate that the rupture on the fault stopped 11km below Kathmandu. This leaves an upper portion that remains unbroken and will build up more pressure over time as India continues to collide with Nepal, and indicates that another major earthquake could take place within a shorter timeframe than the centuries that might be expected for the area.
Dr Elliott added: “As this part of the fault is nearer the surface, the future rupture of this upper portion has the potential for a much greater impact on Kathmandu if it were to break in one go in a similar sized event to that of April 2015.
“Work on other earthquakes has suggested that when a rupture stops like this, it can be years or decades before it resumes, rather than the centuries that might usually be expected.”
Study co-author Dr Pablo González, from the School of Earth and Environment at the University of Leeds and also a COMET member, said: “We successfully mapped the earthquake motion using satellite technology on a very difficult mountainous terrain. We developed newly processing algorithms to obtain clearer displacement maps, which revealed the most likely fault geometry at depth to make sense of the puzzling geological observations.”
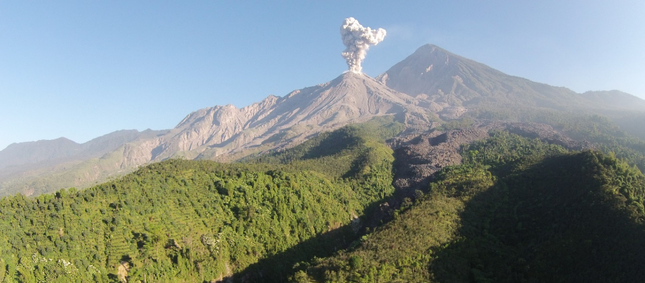
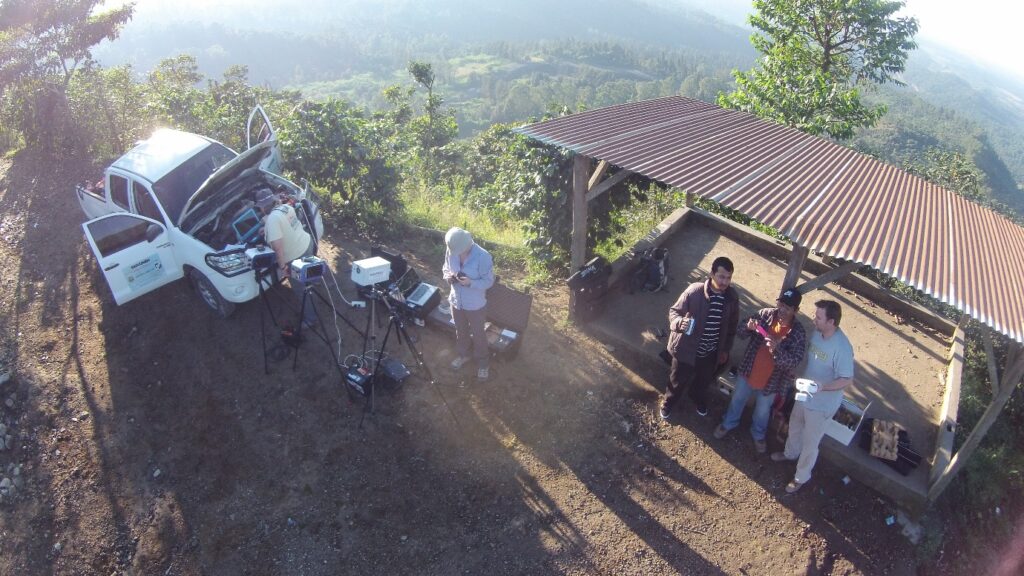
Scientists from COMET are participating in a workshop, funded by the US National Science Foundation, to study Santiaguito volcano, Guatemala.
SUAS shot of an explosion at Santiaguito volcano, January 9 2016
Matt Watson, Luke Western and Kate Wilkins have been in Guatemala since January 2nd, acquiring data with a range of instruments including three UV camera systems, three additional mini-UV spectrometers, a multispectral infrared camera, a lightweight infrared camera and a Phantom II Small Unmanned Aerial System (SUAS).
SUAS selfie showing an array of IR and UV cameras
The meeting, the first in a series of scientific and educational workshops to be held at an active laboratory volcano every two to three years, is lead by a selection of principal scientists who have different field-based data collection expertise.
They, along with students and local scientists, conducted fieldwork just prior to the formal workshop. During the main phase of the workshop additional participants, including other students and professionals, arrived and had an opportunity to both observe the field installations and participate in data collection.
Formal lectures, on both measurement techniques and recent findings on shallow conduit processes at Santiaguito, were given by the principal scientists on January 5th. Different groups then headed out for four days to make various observations and measurements of the volcano.
The focus for the following two days, the last of the workshop, was on breakout groups and hands‐on analysis of the multiple data types that were collected concurrently. Everyone participating in the workshop, including students and principal scientists, shared and received all the data products at the end of the workshop.
Following the workshop, analytical results, tools, and integrated products will be delivered to the participants and published electronically for the broader community.
Watson, Western and Wilkins, with Helen Thomas from Nicarnica Aviation, are now heading to both Pacaya and Fuego volcanoes. At Pacaya they hope to undertake a drone survey of the crater by adapting the Phantom II to fly the lightweight IR camera. At Fuego, they will acquire more imaging and spectral measurements of the volcano’s emissions and investigate installation of the multispectral infrared camera.
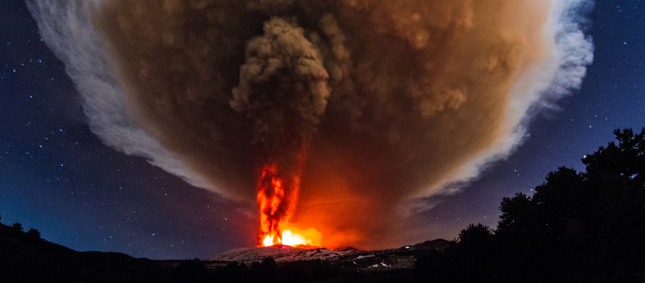
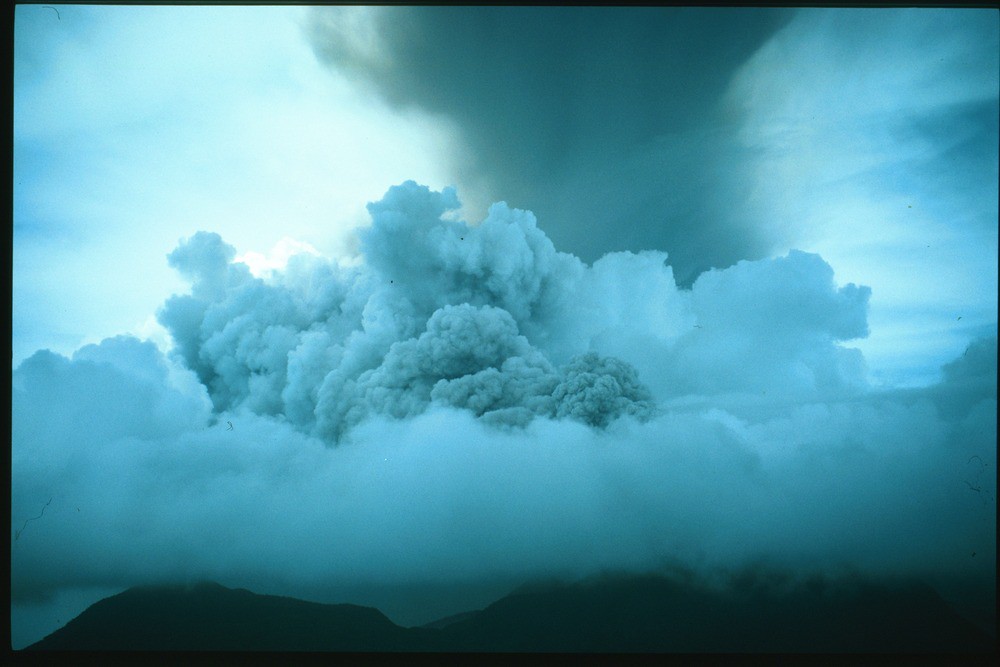
On the evening of December 2 2015, Sicily’s Mount Etna began to erupt for the first time in over two years, reaching a brief but violent climax in the early hours of December 3 which included lava fountains as well as a column of gas and ash several kilometres high. The event was among the most violent seen at Etna over the last twenty years.
Ash cloud from Mount Etna’s Voragine crater lights up the sky. Credit: Marco Restivo/Demotix/Corbis
Luckily, good weather meant that the eruption could be monitored with visual and thermal cameras from the Istituto Nazionale di Geofisica e Vulcanologia (INGV) Etna Observatory. According to INGV reports, activity peaked between 02:20 and 03:10 GMT when a continuous lava fountain reached heights well above 1km; with some jets of volcanic material reaching 3km into the sky. Although the eruption had more or less ceased by dawn, the volcanic cloud had blown northeast, causing ash to be deposited on the nearby towns of Taormina, Milazzo, Messina and Reggio Calabria.
The eruption has so far continued, repeating the behaviour seen earlier with tall lava fountains and eruption columns many kilometers high. Updates can be found on the INGV webpage.
COMET scientists at the University of Oxford have been tracking the volcanic plume’s progress using data from the Infrared Atmospheric Sounding Instruments (IASI) on board ESA’s MetOp-A and MetOp-B satellite platforms. These instruments can detect the presence of volcanic SO2 in the atmosphere, using methods developed by the University’s Earth Observation Data Group.
The results, which can be found on the IASI NRT web page, showed that by Friday 4 December the plume had reached an area between Crete and Iraq, containing 0.06 Tg (1012g) SO2.
Estimate of SO2 amount from IASI-A overpass on the morning of 3 and 4 December 2015, assuming the SO2 between 9 and 10 km altitude
By the morning of 7 December, the plume had travelled from Sicily to Asia, reaching as far as Japan and the Pacific Ocean.
Screenshot from IASI NRT webpage 7 December 2015
Dr Elisa Carboni, a COMET researcher based at the University of Oxford, said: “This is a great example of how we can track volcanic plume using the near real time IASI service. ”
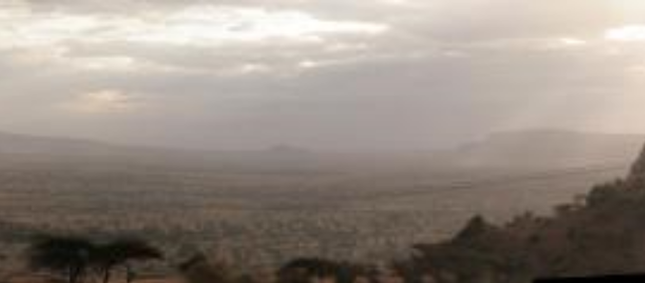
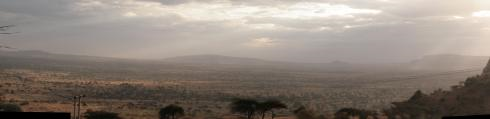
Are the volcanoes of the Ethiopian Rift Valley now peaceful, or do they continue to pose a threat to the tens of millions of people who live and work the land across this vast region?
View into the Main Ethiopian Rift Valley, on the descent from Butajira to Ziway. Aluto volcano in the centre distance.
Read COMET scientist David Pyle’s blog post on the work of the NERC-funded RiftVolc consortium, which is carrying out a broad-scale investigation of the past eruptive histories, present status and potential for future activity of the volcanoes of the Central Main Ethiopian Rift.
Around 20 scientists gathered at the University of Leeds recently to share their knowledge and their views on how magmatic activity can be understood and reproduced by models of volcanic processes.
Fourteen COMET members, including scientists, research staff and students, were joined by experts in various fields of volcanology from other world-leading institutions such as the United States Geological Survey, the University of Geneva and the University of Liverpool.
At the workshop we discussed the numerous challenges we face when we try to experimentally replicate natural processes such as those occurring at volcanoes. The most important limitation is that we can exclusively witness and measure what happens at the surface of the volcanoes, and only indirectly infer what goes on beneath them.
There are many different techniques commonly used to take the pulse of the magmatic activity: we measure how the volcanic edifices deform, we record seismic waves coming from and travelling through the magmatic systems, we collect and analyse lava and ash samples during eruptions, we measure the concentration of gases emitted by volcanic vents etc.
The rapid expansion and improvement of satellite Earth Observation (EO) techniques (such as radar interferometry to measure deformation, infrared atmospheric sounding to measure gas emissions etc.) offers further opportunities to study magmatic processes at a global scale.
Although each technique can shed light on one or more volcanic processes, the highest chance of truly understanding what controls the magmatic activity happens when all the measurements and information are analysed together.
The use of a multi-disciplinary approach was the key element of the COMET workshop and all participants agreed that future research in volcanology must move in this direction. Conceptual and numerical models of how magma is stored beneath the surface must be able to reconcile the observed deformation, the amount of gasses released in the atmosphere and the physical/chemical properties of the erupted products. Models of how magma reaches the surface during eruptions need to explain the seismic signature of magma ascent, be compatible with the mechanical properties of volcanic rocks, and consider magma as a multi-phase fluid containing gas, liquid and crystals.
During our workshop, we identified several potential research projects that will be developed in the coming months and that will imply the use of information from different disciplines of volcanology. For example, we aim to globally classify active volcanoes on the basis of their behaviours in terms of deformation and gas emissions. Much effort will also be put in understanding the characteristics of magma reservoirs, moving from conceptual models of simple liquid-filled cavities to complex, multi-phase, dynamic systems.
Finally, specific volcanoes where COMET scientists already have access to long records of geophysical, geochemical and petrological data (for example Soufriere Hills Volcano in Montserrat or Kilauea Volcano in Hawaii) will be used as natural laboratories. At these locations, we will test models that try to reproduce processes ranging from specific eruptive behaviours to long-term magma supply to the volcanoes.
For further information, contact Dr Marco Bagnardi [email protected]
COMET researchers have unravelled a complex seismic sequence using a combination of techniques, explaining not only the earthquake sequence itself but also the formation of the mountain range where it occurred.
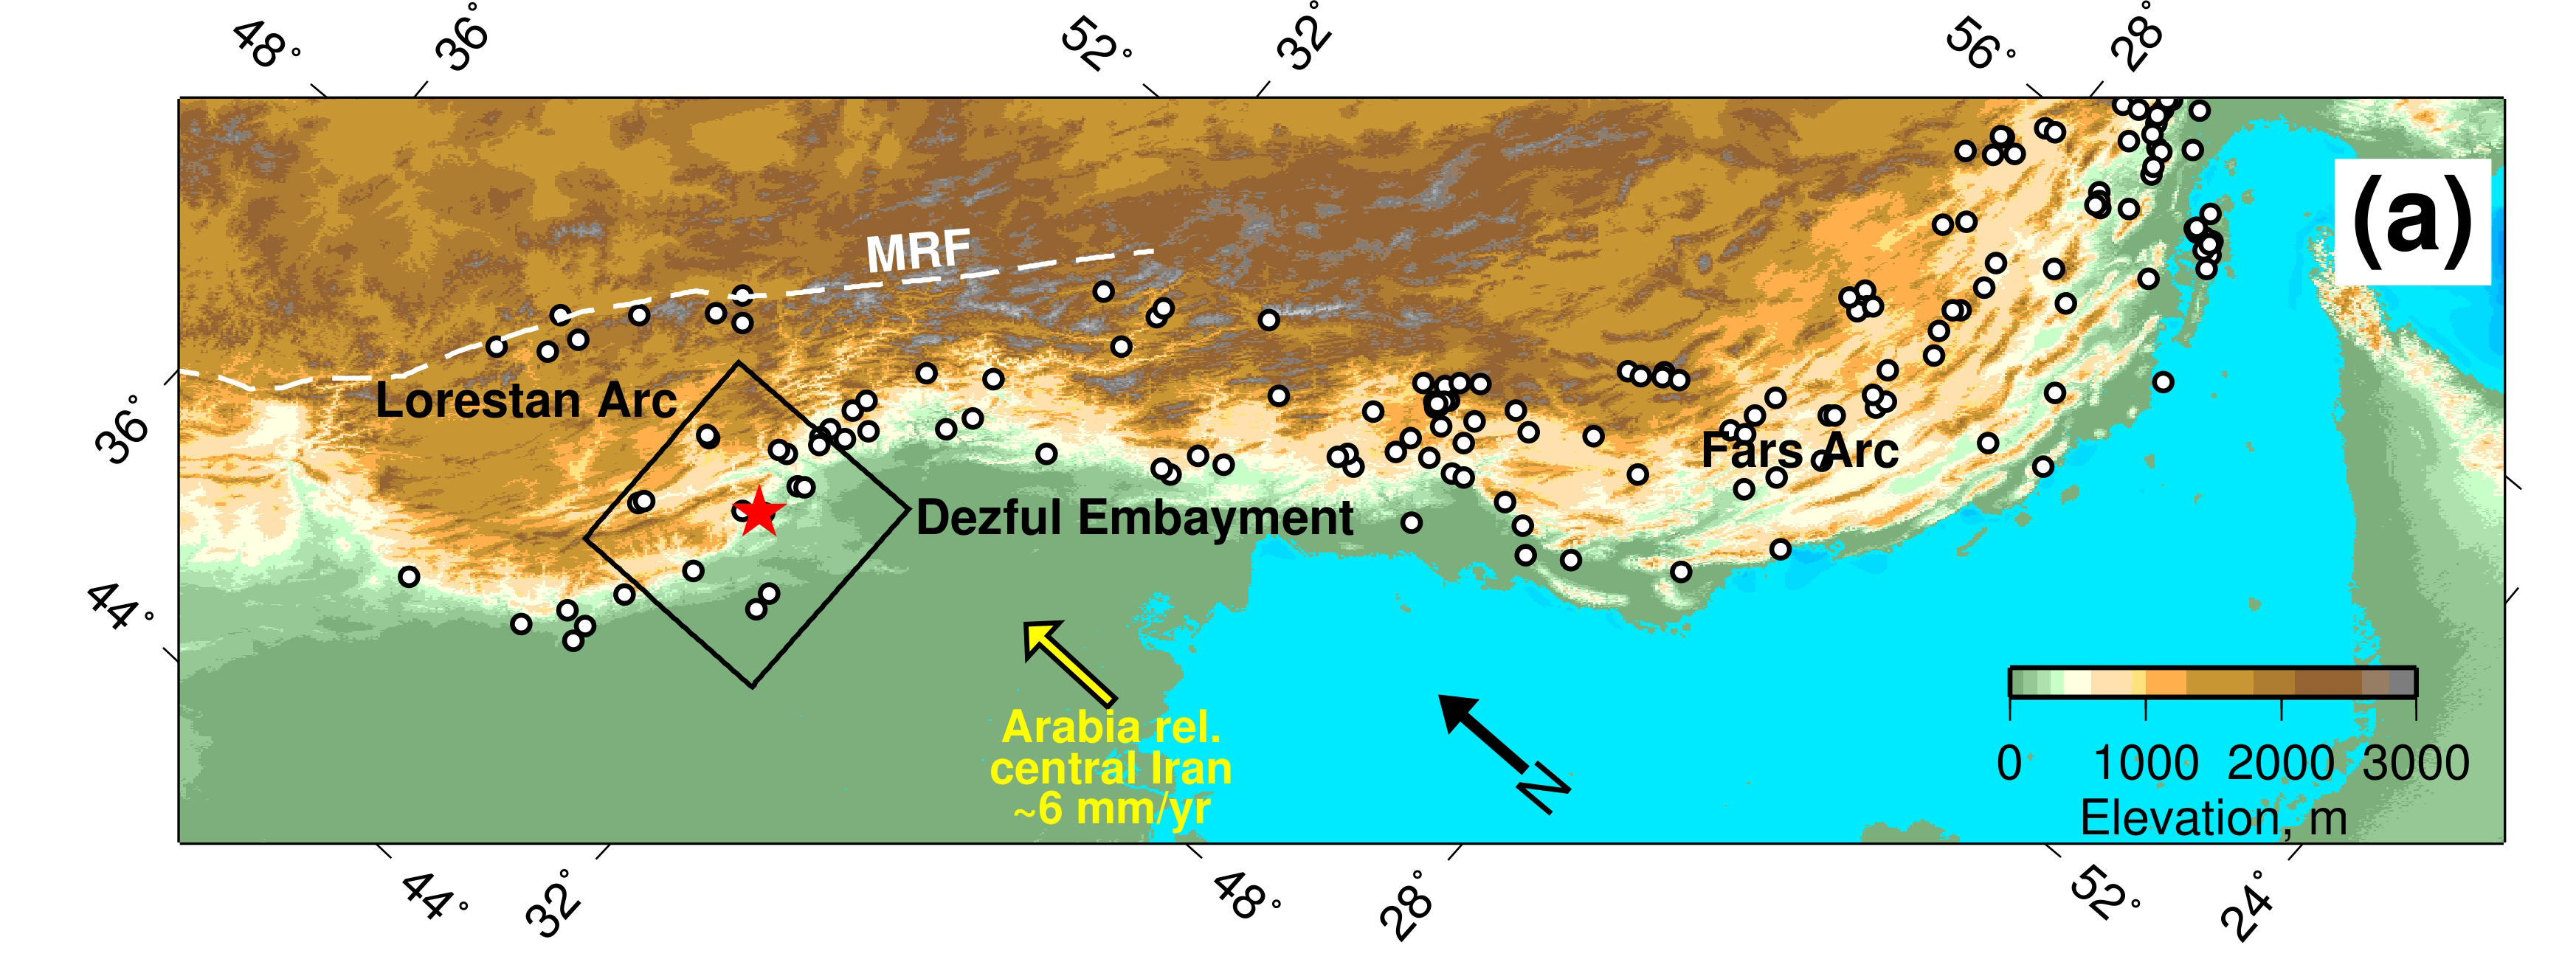
On August 18 2014, an Mw 6.2 earthquake struck Murmuri, near Dehloran in the Zagros Mountains of South West Iran (Figure 1), and was followed by five aftershocks of Mw of at least 5.4. The largest of these was a Mw 6.0 aftershock which took place 16 hours after the main event.
These were the first large seismic events in the region since important developments in satellite Earth Observation (EO) have allowed us to study earthquakes in unprecedented detail, providing the potential to combine a range of satellite-based and seismological approaches.
The study team, which included COMET scientists from Cambridge and Oxford along with colleagues from Iran, Colorado, and Canada, saw this as an opportunity to shed light not only on the Murmuri earthquake but also on how the Zagros Mountains themselves are evolving.
Figure 1 below shows the distribution of earthquakes in the region along with the 2014 Murmuri event.
Figure 1: Earthquakes and topography of the Zagros Mountains. White circles show events of magnitude 5.0 and larger (Nissen et al., 2011). The red star shows the Murmuri mainshock.
The depth of the earthquake-generating thrust faults in the Zagros Mountains has been the subject of debate for some time. Previous studies have disagreed on whether the faults break a thick sequence of sedimentary layers, or are confined to the underlying crystalline rocks.
Importantly, rather than using a single technique, the team combined satellite-based EO techniques with studies of the seismic waves generated by the earthquake and aftershocks. The first step was to identify their locations, which was crucial to understanding the relationship between the ground motions detected by InSAR and the fault planes that caused the earthquakes. They then used the results to generate models of the faults.
Modelling the seismic waves showed that all except one of the events were caused by thrust faults. The smooth signals in the InSAR interferograms meanwhile showed that the faulting which led to the earthquake was buried deep under the surface.
Figure 2: Interferograms of the 18 August 2014 earthquake. Each interferogram is labelled with the dates of the two SAR acquisitions in the format YYYYMMDD, and the background shading is the topography.
The next question was whether the earthquakes had been caused by a single or multiple faults. The interferograms showed distinct lobes extending to the east and southeast of the main affected area, suggesting that the displacements on the surface were caused by two if not three separate faults.
COMET’s Alex Copley, from the Department of Earth Sciences at the University of Cambridge, explained: “ We found that a single-fault model couldn’t reproduce the deformation patterns shown by the interferograms, so we investigated by applying multiple-fault models instead.”
The team modelled the faults to establish characteristics including their direction, length and angle. When they used the interferograms alone there were a wide range of different fault parameters that could produce models that matched the data, but by including the seismic data the team could narrow down these characteristics.
Dr Copley added: “The only way we managed to work out what actually happened was by using seismological techniques, and then using these results to interpret the satellite measurements.”
The results showed that the 18 August 2014 event involved significant slip on two planes, which produced a complex displacement pattern in the InSAR, and that there were two separate events big enough to produce surface deformation signals, hence the two lobes on the interferograms.
It also became clear that most if not all of the faulting took place in the sedimentary layers rather than the igneous rocks below, at depths of 3-9km. The faults were also found to be longer than they were deep, which is relatively unusual – most faults tend to be more or less equal in length and depth. This could be because changes in the mechanical properties of the rocks below stop the faults from extending any deeper.
As well as explaining the events at Murmuri, the results throw light on the large scale tectonics of the Zagros Mountains, showing which combination of tectonic forces and material properties of the rocks can give rise to the shape and deformation pattern of the mountain range.
Dr Copley summarised: “If we had used seismology or satellite measurements alone we would have failed to learn much that was new about this earthquake sequence. Instead, our approach allowed us to shed light not only on the formation of the Zagros, but also how similar fold-thrust belts form across the globe.”
COMET researchers have used the European Space Agency’s Sentinel-1A satellite to shed light on the 2014-15 eruption at Fogo, the most active volcano in the Cape Verde archipelago.
Their paper, published in Geophysical Research Letters, investigates the eruption using Sentinel-1A’s new radar acquisition mode, Terrain Observation by Progressive Scans (TOPS).
Fogo has erupted at least 26 times in the last 500 years, and this particular event lasted 81 days from November 2014 to February 2015. It had devastating consequences for the island. Fast lava flows destroyed the villages of Portela and Bangaeria in early December 2014.
As the satellite had only been operating for a few weeks when the eruption began, this is the first study to use Sentinel-1A TOPS to investigate surface deformation associated with volcanic activity.
Lead author Dr Pablo J. González, from the University of Leeds, explained: “the study has given us a real insight into the inner workings of Fogo volcano. It also shows the potential of Sentinel-1’s TOPS mode for monitoring volcanic activity in the future acheter du viagra.”
Up until recently, the volcano had mostly been monitored by a GPS network with limited spatial coverage. In comparison, the wide area and high spatial resolution of Sentinel-1A’s satellite images allowed the team, which included researchers from Norway, The Netherlands and Canada, to monitor ground deformation across Fogo.
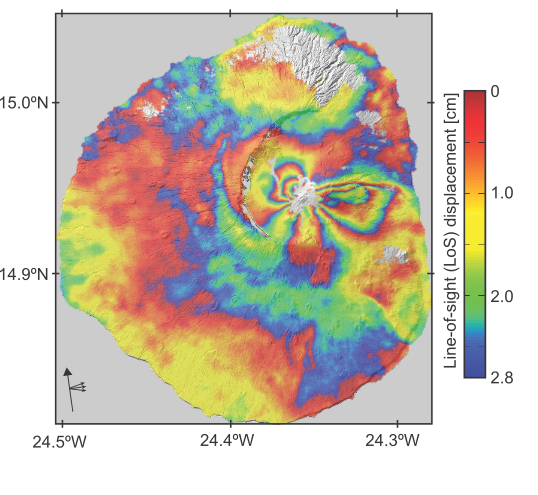
Using the TOPS data, they found that during the eruption the ground surface had changed in a “butterfly” shape, characteristic for a dike intrusion (where the magma intrudes into a fissure, shouldering aside other the existing layers of rock).
Sentinel-1A ascending interferogram spanning the onset of the2014-2015 Fogo eruption (3 – 27 November 2014). Each colour fringe represents ~3 cm of ground displacement.
Models created to reproduce the observed data then showed that first of all the magma moved rapidly from depths of more than ten kilometres below the volcano’s summit. It then moved along the dike to feed the eruption at a fissure on the southwestern flank of the volcano’s summit cone, rather than from its top.
This was backed up by the satellite data showing a lack of deformation across the whole island during the eruption, which would have suggested that it was instead being fed by an inflating/deflating magma reservoir directly beneath.
The findings will now set the direction for further research aimed at understanding the pattern of eruptions on the island, as well as assessing the stability of the entire volcanic structure.
Dr Marco Bagnardi, COMET researcher, and also co-author in this paper, added: “Our results not only show the importance of near-real time ground deformation monitoring at Fogo, they also demonstrate the potential of Sentinel-1A’s TOPS mode for monitoring geohazards more widely.”
A huge volcanic eruption in Iceland emitted on average three times as much of a toxic gas as all European industry combined, a new study has revealed.
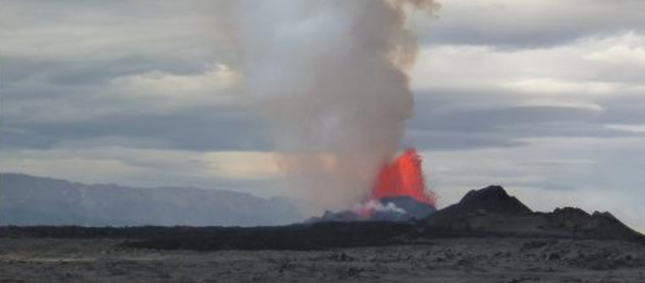
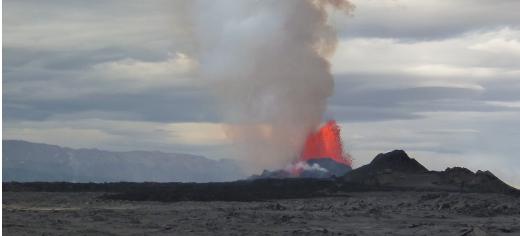
Bárðarbunga eruption. Credit: John Stevenson.
Discharge of lava from the eruption at Bárðarbunga volcano, starting in August 2014, released a huge mass – up to 120,000 tonnes per day – of sulphur dioxide gas. You can watch a video of the eruption here.
These emissions can cause acid rain and respiratory problems.
Dr Anja Schmidt, a COMET Associate from the School of Earth and Environment at the University of Leeds, who led the study, said: “The eruption discharged lava at a rate of more than 200 cubic metres per second, which is equivalent to filling five Olympic-sized swimming pools in a minute. Six months later, when the eruption ended, it had produced enough lava to cover an area the size of Manhattan.
“In the study, we were concerned with the quantity of sulphur dioxide emissions, with numbers that are equally astonishing: in the beginning, the eruption emitted about eight times more sulphur dioxide per day than is emitted from all man-made sources in Europe per day.”
The eruption last year was the biggest in Iceland for more than 200 years. It released a river of lava across northern Iceland, and lasted for six months.
The team, which also included COMET members Tamsin Mather, Elisa Carboni and Don Grainger from the University of Oxford, used data from satellite sensors to map sulphur dioxide pollution from the eruption. These were reproduced by computer simulations of the spreading gas cloud.
As well as being given off by volcanoes, sulphur dioxide is also produced by burning fossil fuels and industrial processes such as smelting. Man-made sulphur dioxide production has been falling since 1990, and was recorded at 12,000 tonnes per day in 2010.
Further information
The research was funded by the Natural Environment Research Council (NERC) and the Royal Society of Edinburgh.
Post by Richard Walters, Research Fellow at the University of Leeds with COMET and the Earthquakes without Frontiers project ([email protected])
Active faults and the devastating earthquakes they can trigger do not respect political borders. Whilst the recent earthquakes in Nepal did most damage to the mountain kingdom itself, hundreds of people were also killed or injured in neighbouring China, India and Bangladesh.
The region’s history tells a similar story – the three countries’ earthquake records over the last 500 years are intertwined by shared proximity to the Himalayan mountain belt and its underlying megathrust fault.
Ways of improving resilience to earthquake hazard also need to transcend political boundaries, bringing together scientists and policymakers from the affected countries to share knowledge, experience and ideas.
This principle has led to the Earthquakes without Frontiers (EwF) partnership – a diverse group of natural and social scientists from around the UK. Led by James Jackson of both COMET and the University of Cambridge, EwF is a 5-year initiative funded by NERC and ESRC (the Natural Environment and Economic and Social Research Councils) under the Improving Resilience to Natural Hazards programme.
As well as COMET, the partnership includes researchers from Cambridge, Durham, Hull, Leeds, Northumbria and Oxford Universities, the British Geological Survey, the Overseas Development Institute and Durham’s Institute of Hazard, Risk and Resilience.
The project focuses on three broad regions – China, the Himalayan mountain front (Nepal and Northern India) and Central Asia (Kazakhstan and Kyrgyzstan) – with the key objective of furthering knowledge on earthquakes and landslides in the continental interiors.
Much of this involves using remotely sensed data which complements the project’s cross-border approach. EwF scientists use digital topography and multispectral and optical imagery to research landslide hazard and map active faults, alongside satellite radar to measure the warping of the Earth’s crust and steady interseismic motions as faults build up stress before the next seismic event.
All of this contributes to a wider programme of social and natural scientific research with scientists in the partner countries, as well as being used to run workshops and training events for young international scientists.
Crucially, this knowledge exchange extends to countries dealing with similar hazards – the same types of fault that threaten vast regions in China also cause earthquakes in Italy, and lessons learnt about Iranian faults can inform work on hazard in Kazakhstan and vice versa. As such, EwF brings together scientists from many countries to share knowledge and experience across an even wider network, culminating in the annual EwF partnership meetings, the most recent of which was held in Kathmandu in April 2015.
When a huge Mw7.8 earthquake struck Nepal on the 25th April, it came as a double blow to all within EwF. Nepal is not only one of our focus areas, but many of the UK team also had been in Kathmandu just one week before the earthquake, working and living alongside Nepali colleagues and friends.
The International Charter for Space and Major Disasters was invoked just 3 hours after the earthquake, and over the following few days, space agencies hurriedly tasked their satellites to acquire new imagery over Nepal. We all felt strongly that we should put our combined experience to good use in the immediate aftermath of the Nepal earthquake, and dashed to obtain satellite imagery of the area. In the weeks since we have been working to analyse this imagery in order to aid both disaster relief efforts and hazard re-evaluation.
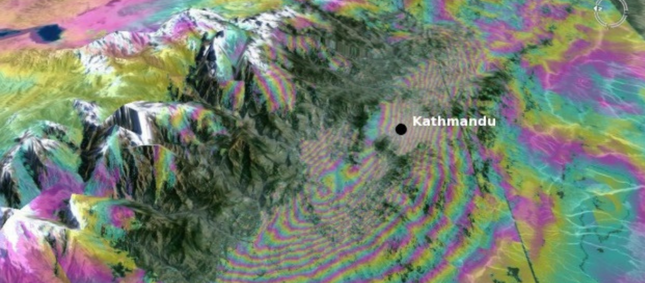
Figure 1: Satellite radar interferogram of the 25 April 2015 Mw7.8 Nepal Earthquake. The coloured fringes represent contours of ground motion towards the satellite, at intervals of 8.5 cm. Image credit: Pablo Gonzalez, University of Leeds, EwF, LiCS; SAR data provided by the European Space Agency
EwF researchers, along with colleagues at the University of Leeds, used data from the European Space Agency’s Sentinel-1A satellite to measure how the ground was permanently warped by the earthquake. This was greatly assisted by COMET’s new automated processing facility, designed to cope with the vast amount of data from the Sentinel-1 satellites, which helped to produce some of the first radar interferograms of the Nepal earthquake. These mapped how the ground was warped along a 170 km stretch of the fault, moving by up to ~1.4 m near Kathmandu.
We are now modelling the data to understand how the fault slipped at depth, establish the relationship with the large Mw 7.3 aftershock on the 12th May, and gauge how these events may have stressed the surrounding regions, making them more likely to fail in future.
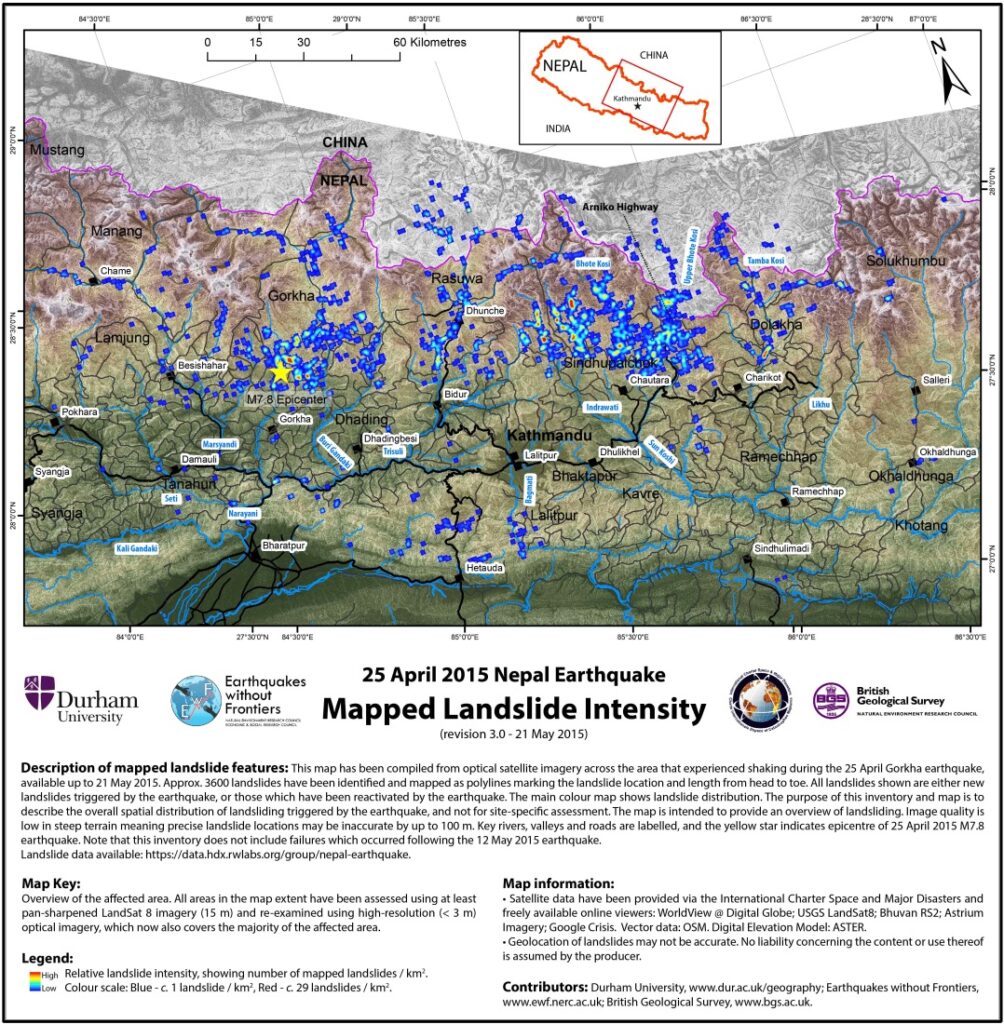
At the same time, EwF scientists at Durham University and the British Geological Survey have been using high-resolution optical and multispectral imagery to map landslides in the region. We have identified around 3,600 landslides that were either triggered or reactivated by the earthquake, using the maps to show where rivers are likely to be dammed and roads blocked. This has also highlighted the need to plan for the monsoon season which may reactivate or trigger even more deadly landslides.
Figure 2: Landslide map. Colour scale shows landslide intensity, with blue ~ 1 landslide/km2 and red ~29 landslides/km2. ( http://ewf.nerc.ac.uk/2015/05/28/nepal-updated-28-may-landslide-inventory-following-25-april-nepal-earthquake/) Image credit: University of Durham, EwF, BGS. Satellite data have been provided via the International Charter for Space and Major Disasters and freely available online viewers: WorldView @ Digital Globe; USGS LandSat8; Bhuvan RS2; Astrium Imagery; Google Crisis. Vector data: OSM. Digital Elevation Model: ASTER
Over the coming months, EwF researchers will continue to work on these topics as well as the many more questions raised by the Nepal earthquake. We hope that the lessons learned from this terrible event will bring us one step closer to improving resilience to future earthquakes, not just for Nepal and the countries across its borders, but for all earthquake-prone countries.
This is extremely important to the aviation industry, civil defence organisations and those in peril from volcanic ash fall, using remote sensing techniques to monitor volcanic clouds and return information on their properties.
The paper presents the complex refractive index of volcanic ash at 450.0 nm, 546.7 nm and 650.0 nm from eruptions of Aso (Japan), Grímsvötn (Iceland), Chaitén (Chile), Etna (Italy), Eyjafjallajökull (Iceland), Tongariro (New Zealand), Askja (Iceland), Nisyros (Greece), Okmok (Alaska), Augustine (Alaska) and Spurr (Alaska).
To provide the best experiences, we use technologies like cookies to store and/or access device information. Consenting to these technologies will allow us to process data such as browsing behavior or unique IDs on this site. Not consenting or withdrawing consent, may adversely affect certain features and functions.
Functional
Always active
The technical storage or access is strictly necessary for the legitimate purpose of enabling the use of a specific service explicitly requested by the subscriber or user, or for the sole purpose of carrying out the transmission of a communication over an electronic communications network.
Preferences
The technical storage or access is necessary for the legitimate purpose of storing preferences that are not requested by the subscriber or user.
Statistics
The technical storage or access that is used exclusively for statistical purposes.The technical storage or access that is used exclusively for anonymous statistical purposes. Without a subpoena, voluntary compliance on the part of your Internet Service Provider, or additional records from a third party, information stored or retrieved for this purpose alone cannot usually be used to identify you.
Marketing
The technical storage or access is required to create user profiles to send advertising, or to track the user on a website or across several websites for similar marketing purposes.