On 28th March 2025, a 7.7-magnitude earthquake struck Myanmar, affecting large areas of the country and causing widespread destruction. A powerful 6.4-magnitude aftershock followed 12 minutes later, approximately 31 kilometres south of the initial shaking. The country, and surrounding areas, were also subjected to hundreds of smaller aftershocks for weeks after the initial event. Myanmar’s military government have estimated that the death toll has surpassed 3,000 people and an additional 4,500 have suffered injuries. The shallow depth of the earthquake (~10km) caused violent ground shaking and extensive damage to local buildings and infrastructure.
Data from ESA’s Sentinel-1 satellite first captured on 29th March clearly show the physical effects of the earthquake on the region. The earthquake ruptured a remarkably long and simple fault, around 500 km in total length, with a relative motion across the fault of up to around 6 m (west side to the north, east side to the south). Although most of the motion is horizontal, there is also a vertical offset of around 1 m across the fault (east side down).
One of Myanmar’s largest cities, Mandalay, sits close to this extensive ground movement (at around 22°N), explaining the significant human and structural impact of the event.
By combining Sentinel-1 imagery from before and after the earthquake, COMET scientists have been able to measure surface deformation that is clearly visible in the data sets shown below: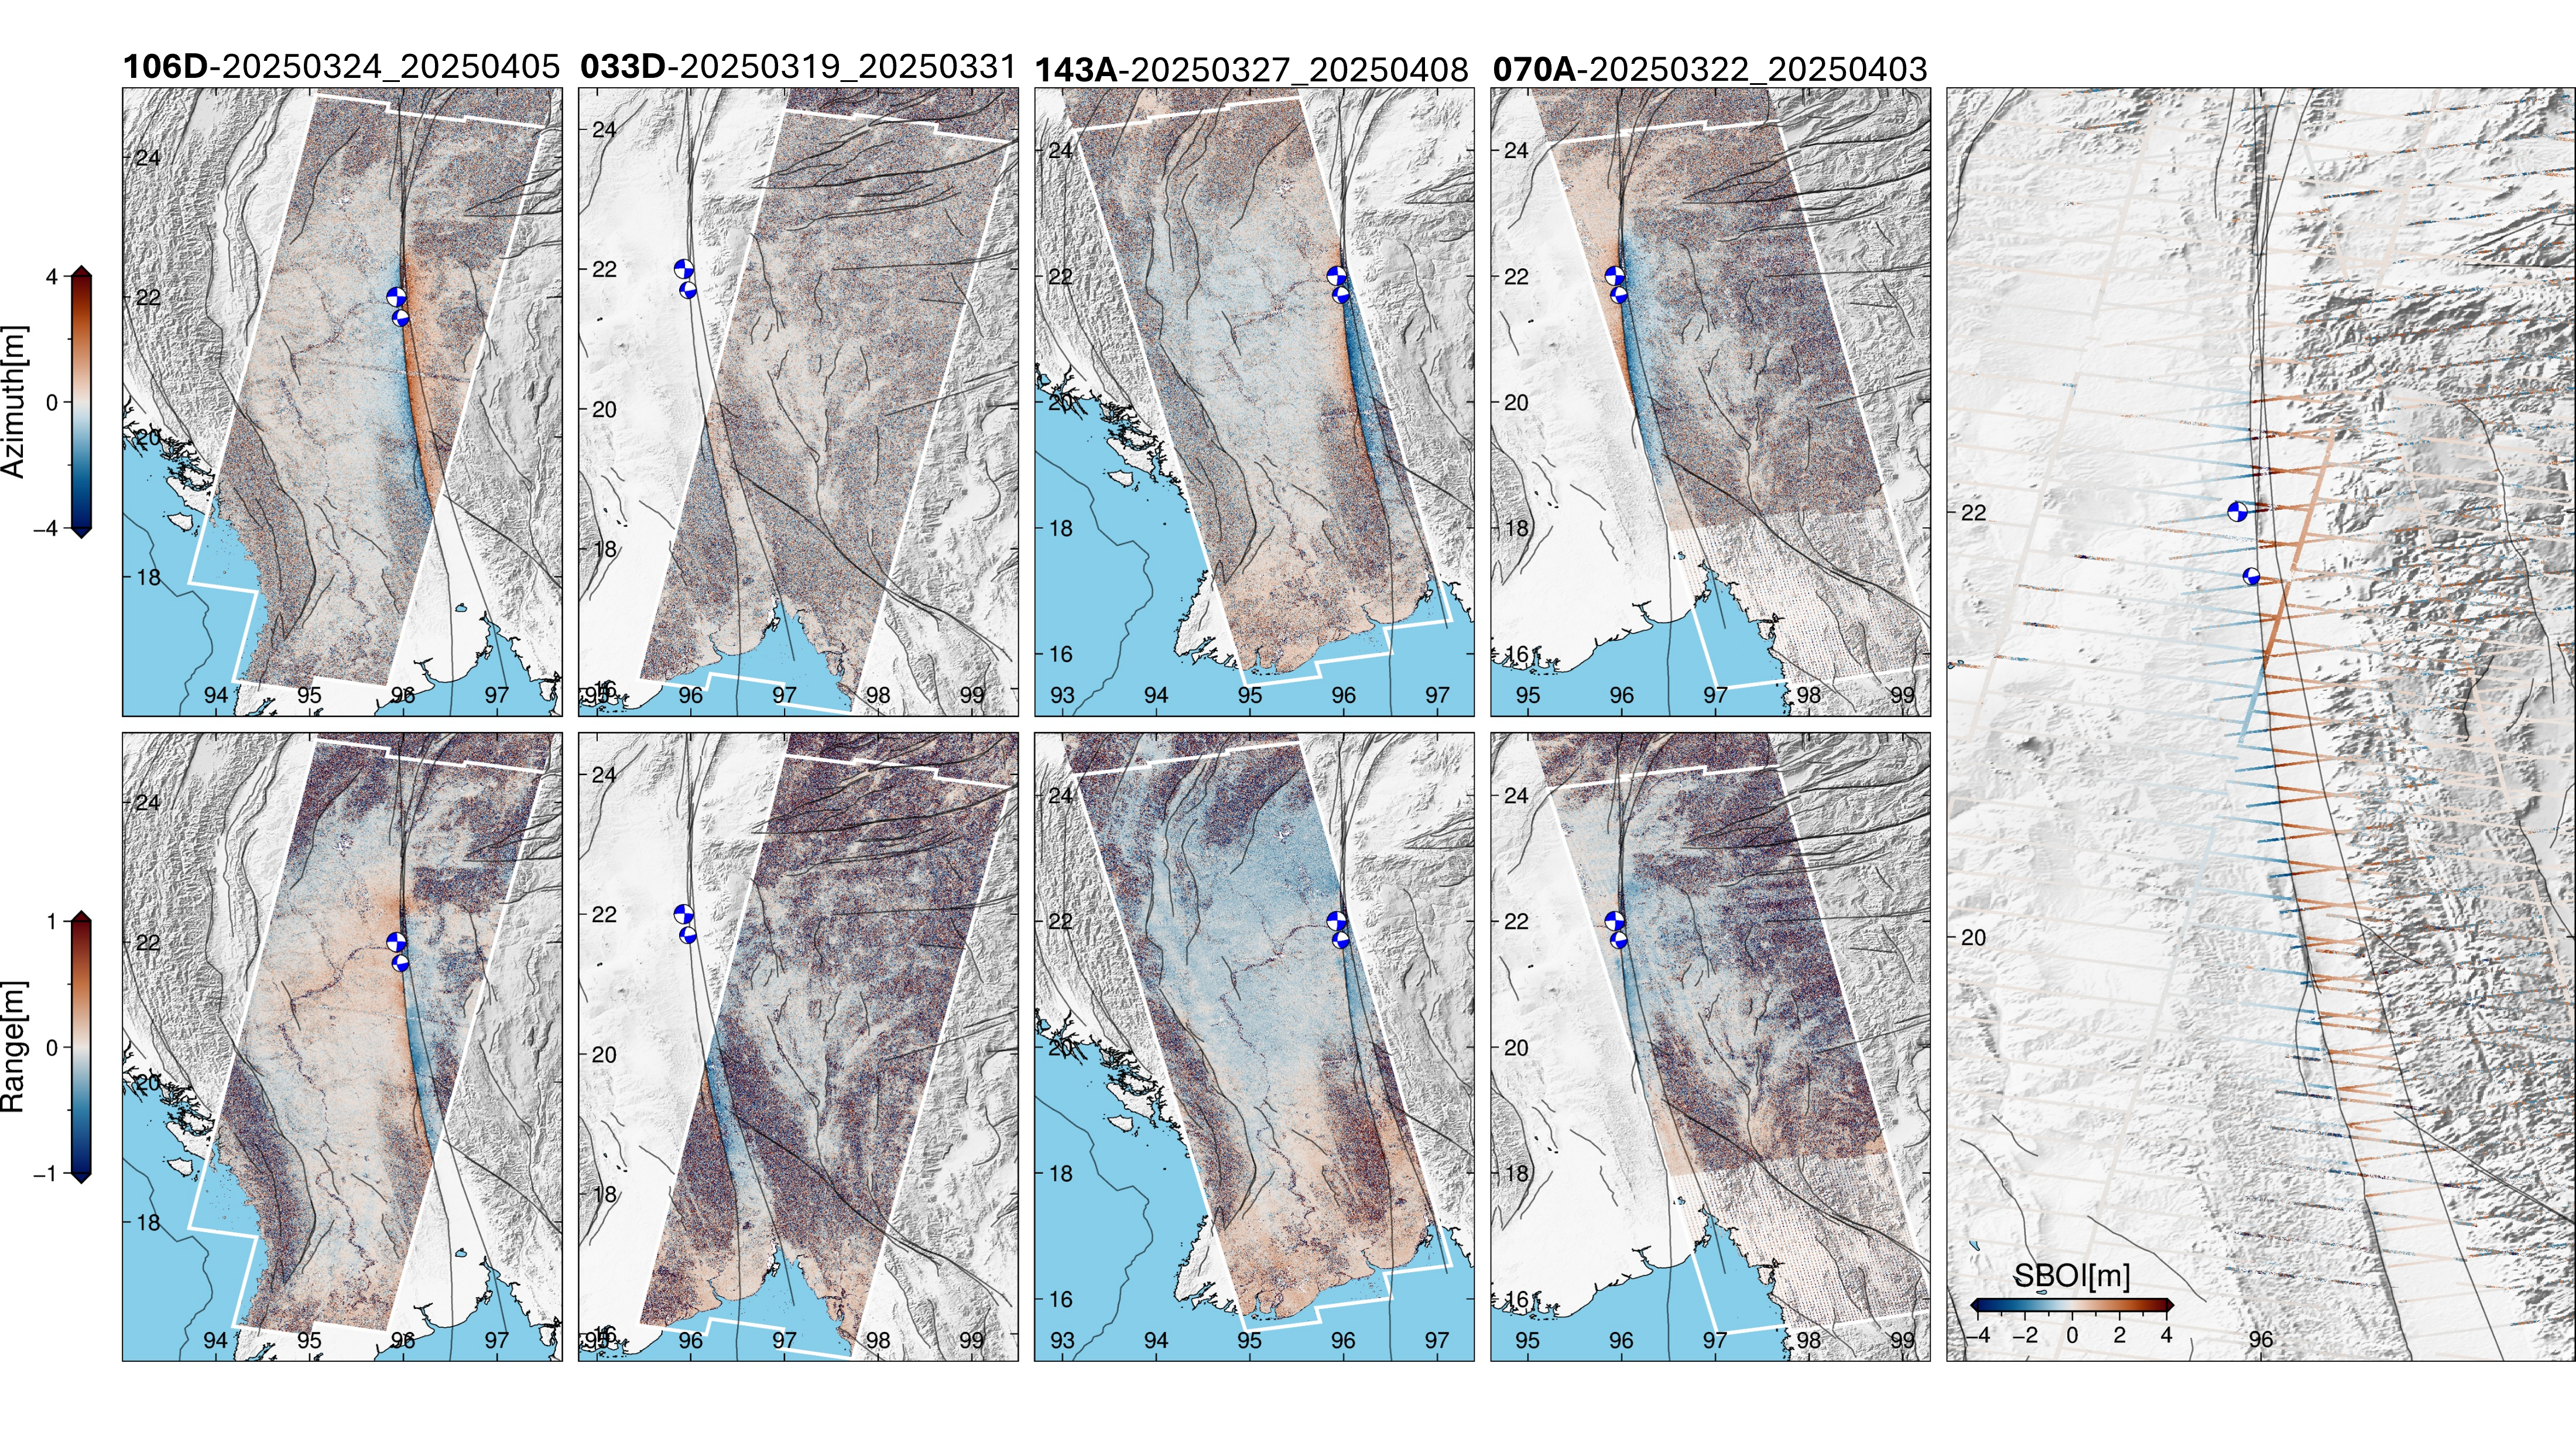 Figure 1: Data from four Sentinel-1 tracks (2 ascending and 2 descending), each consisting of three standard LiCSAR frames (~13 bursts per subswath), were used to cover the deformation zone. Azimuth offsets (top panels) capture along-track (north–south) deformation. Range offsets (bottom panels) represent Line-of-Sight (LoS) deformation. Burst Overlap Interferometry (right) provide high-resolution along-track deformation. Red indicates southward, and blue indicates northward motion.
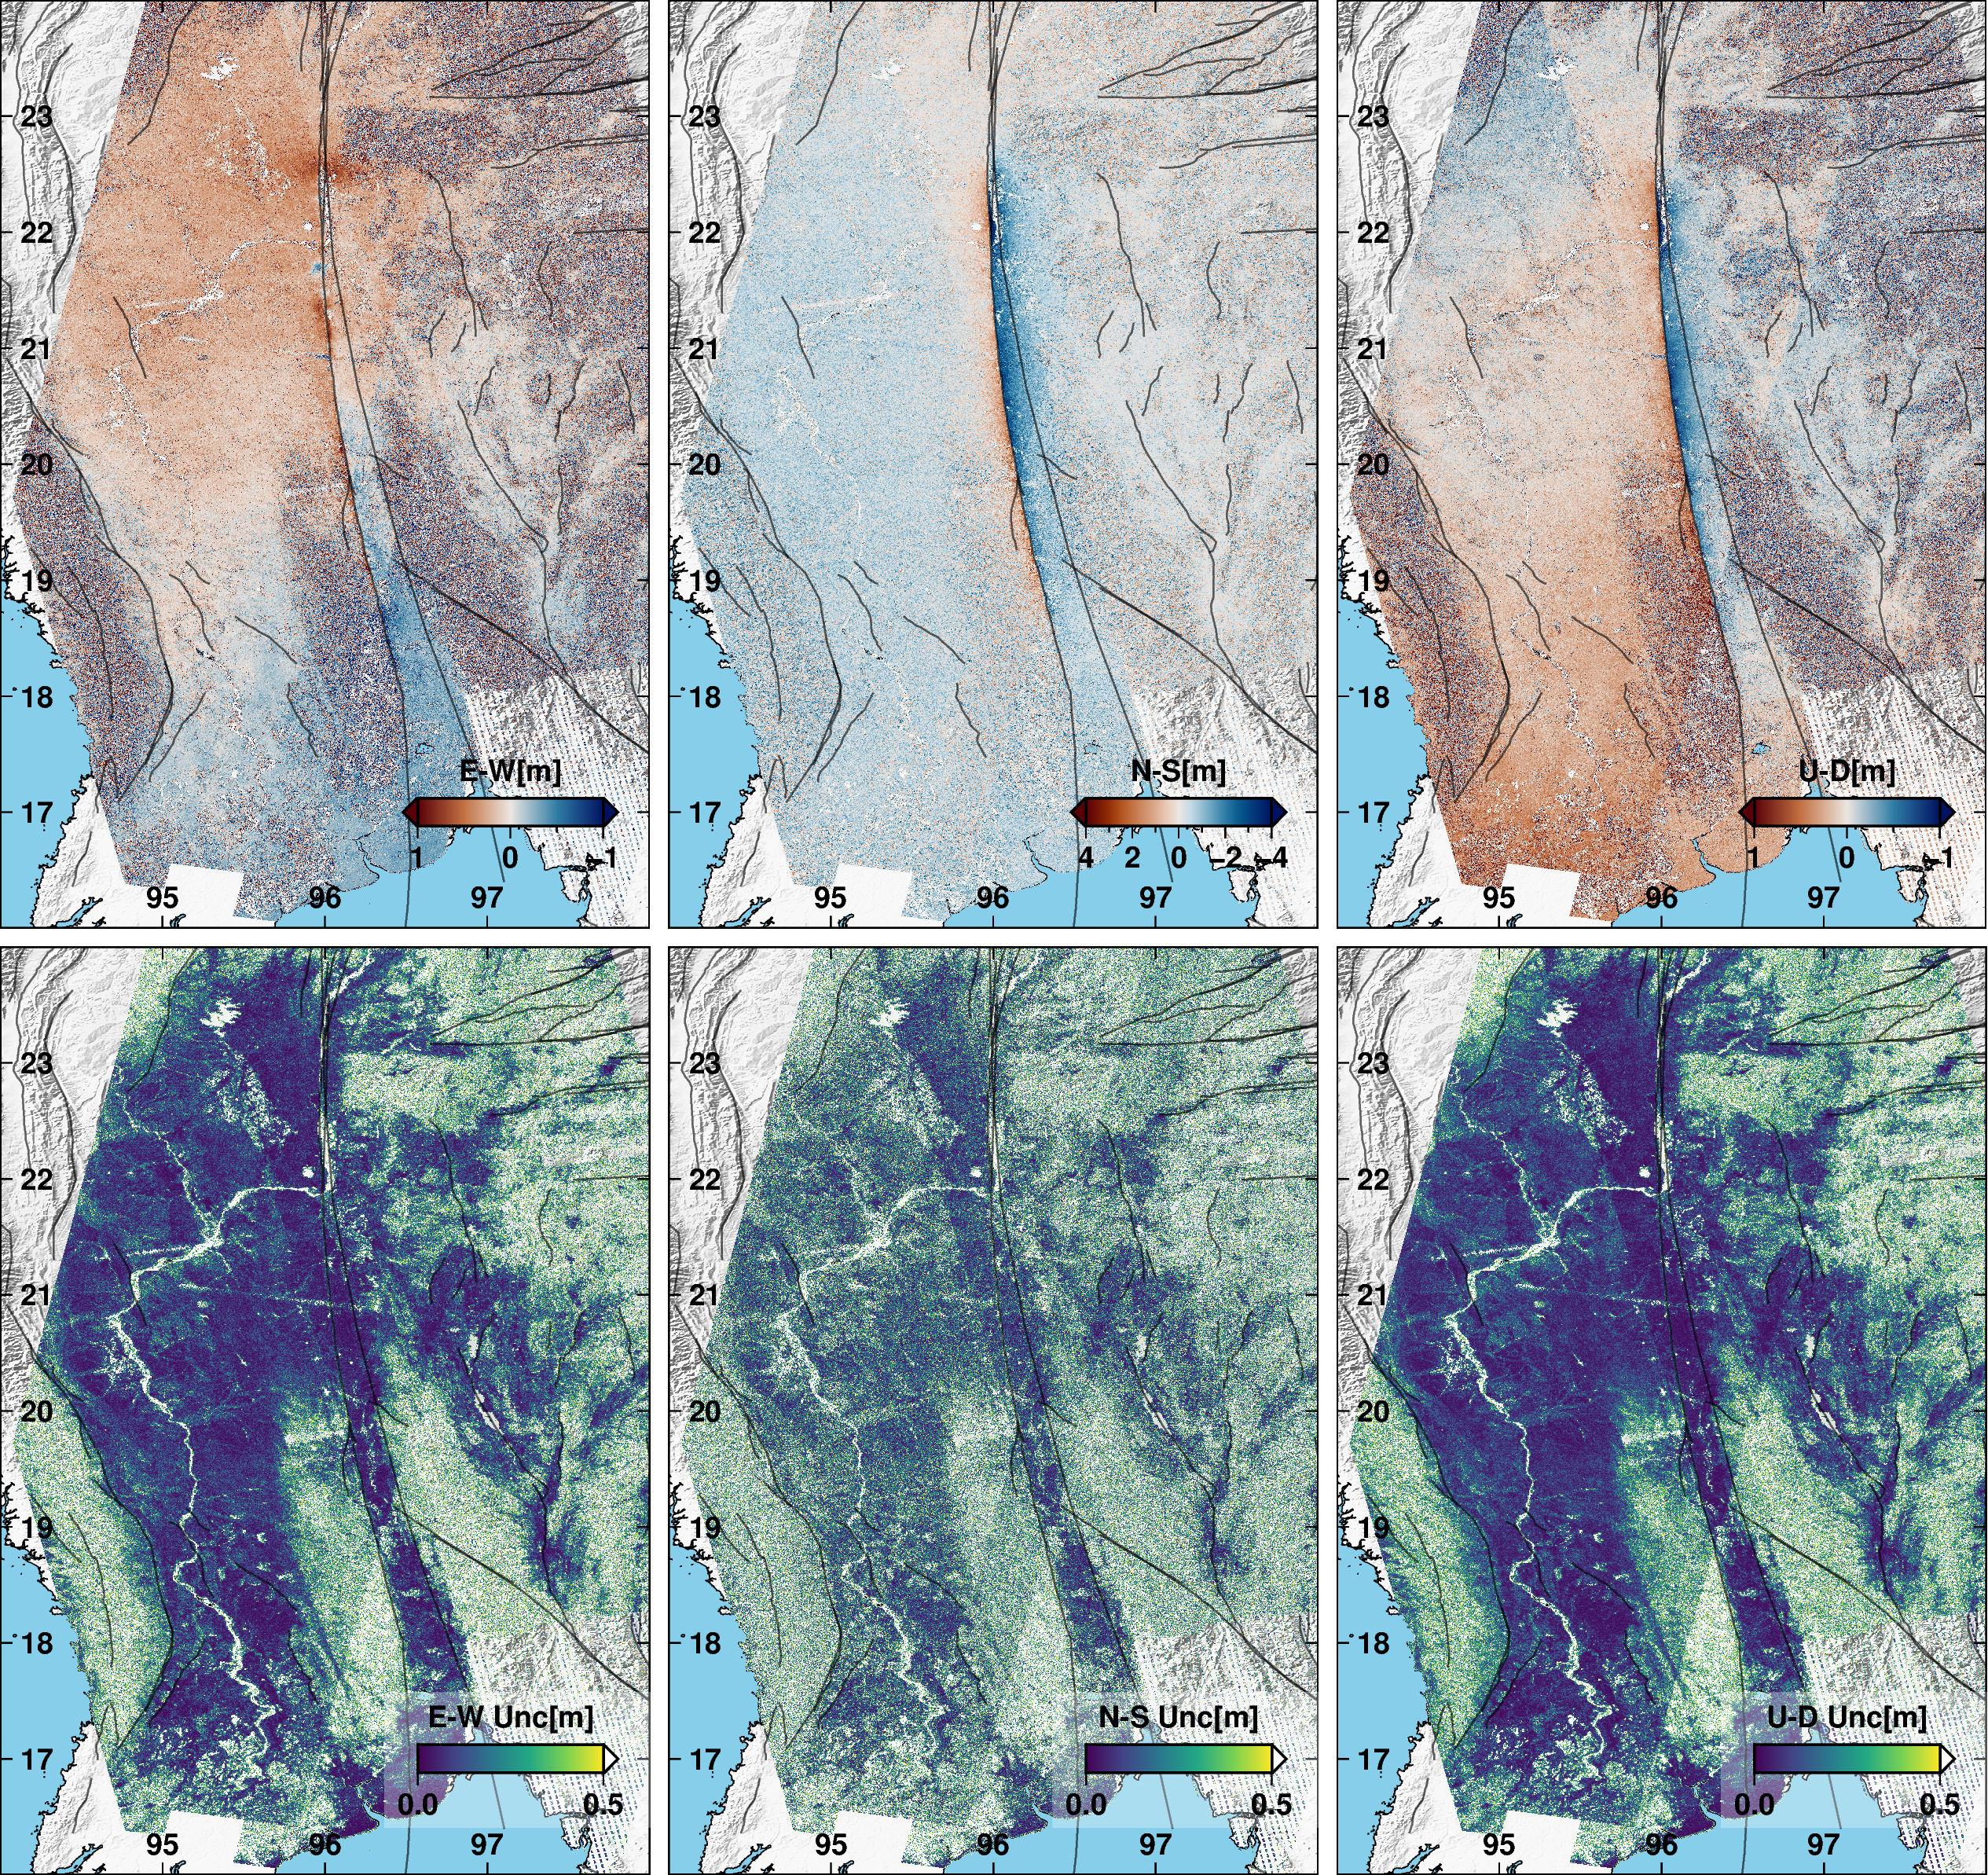
Figure 2: 3D co-seismic displacement fields and associated uncertainties were estimated using a Weighted Least Squares approach applied to the offset tracking datasets. Red colors represent east, north, and up directions, respectively. Only pixels with sufficient multi-geometry observations were used
The processing outputs from Sentinel-1 data are available for download at our LiCSAR system event page.
All related datasets and figures can be accessed here.
The images above contain modified Copernicus Sentinel-1 data analysed by the UK Centre for the Observation and Modelling of Earthquakes, Volcanoes and Tectonics (COMET). Data processing uses JASMIN, the UK’s collaborative data analysis environment (http://jasmin.ac.uk).
For more information on why and how COMET responds to earthquake events read this article by COMET Co-Director, Professor Tim Wright.
Analysis and figures produced by COMET Postdoc Dr Milan Lazecky and PhD student Muhammet Nergizci.
COMET – 17th April 2025