Dramatic data from last year’s major earthquake in Kaikoura, New Zealand, will change the way scientists think about earthquake hazards in tectonic plate boundary zones.
The South Island earthquake was one of the most comprehensively recorded earthquakes in history. Satellite images of the earthquake and its aftermath have enabled scientists to analyse the quake in an unprecedented level of detail.
COMET Director Tim Wright, study co-author, said: “We’ve never seen anything like the Kaikoura quake before, it was one of the most complex ever recorded.
“An earthquake commonly ruptures across a single fault line or faults that are closely grouped; Kaikoura ruptured at least 12 major faults. This challenges many assumptions about how individual faults control earthquake ruptures.”
Immediately following the start of Kaikoura’s earthquake in November, the Sentinel-1 and ALOS-2 satellites were tasked with gathering images and data. COMET researchers at the University of Leeds used the data to provide a rapid analysis of what was happening during the quake.
They found that seismic readings of the earthquake were not giving accurate assessments of where the ruptures were occurring.
Professor Wright said: “Seismic readings are currently the fastest method of gathering earthquake data as they can quickly read shockwaves sent through the earth – but they paint a crude picture. The complexity of the Kaikoura earthquake caused seismologists to completely misinterpret the earthquake based on these seismic waves.
“Satellites such as the European Space Agency’s Sentinel-1 measure the way the ground deforms at very high resolution. The detail in the images showed us that ruptures took place across many separate faults.
“One of the aims of COMET is to expand satellite capability to provide rapid response earthquake data to ensure residents and rescue workers have access to fast and accurate information.”
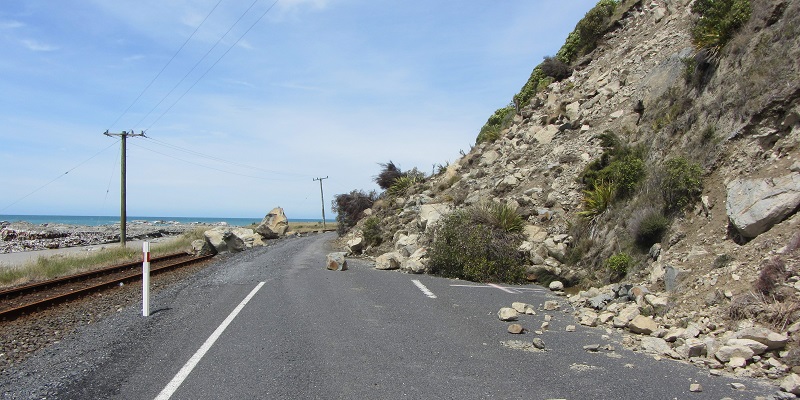
The satellites provided pre- and post-earthquake images to measure the extent of land movement. Kaikaoura’s earthquake caused sections of earth to move up to 25 metres and created surface ruptures measuring 12 metres. This caused large scale landslides and triggered a tsunami.
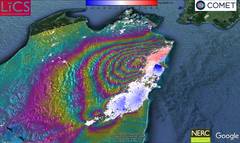
Map of the South Island of New Zealand showing the ground deformation and location of the surface rupture from the November 2016 Kaikoura earthquake. The rainbow contours of ground motion are in 20 cm intervals whilst the red/blue colours show up to +/-6 m of motion near the fault. The sharp change in colour nearer the coast is where the fault has ruptured through to the surface.
In a study published today in Science, the team of researchers reports the full range of data analysed from Kaikaoura’s earthquake, including satellite imagery, field observation, GPS data and coastal uplift data.
The research will prompt reassessment of how many different faults can be involved in a single earthquake and could potentially feed into revaluations of seismic hazard models.
Lead researcher Dr Ian Hamling, a natural hazards geodesist from New Zealand research institute GNS Science, said: “There was growing evidence internationally that conventional seismic hazard models are too simple and restrictive.
“The message from Kaikoura is that earthquake science should be more open to a wider range of possibilities when rupture models are being developed. It underlines the importance of re-evaluating how rupture scenarios are defined for seismic hazard models.”
New Zealand’s complex network of faults are similar to those found in western United States, Japan and central Asia.
Leeds co-author and COMET Associate Dr John Elliott said: “While earthquakes like Kaikoura’s do not commonly occur, the data we’ve gathered from this event will expand our understanding of similar boundary zones around the world.
“Not only could the data help inform us for the future but it may change how we’ve interpreted ancient earthquakes. If an earthquake like Kaikoura’s took place thousands of years ago, current methods of paleo-seismology would possibly see it as a series of earthquakes over a long period of time, rather than as one large single quake.”
The full paper, ‘Complex multi-fault rupture during the 2016 M7.8 Kaikoura earthquake, New Zealand’ was published on 23 March in Science First Release.
Malawi is a small country at the tip of the East African Rift. Small, that is, until you spend several weeks driving around in loops over challenging roads.
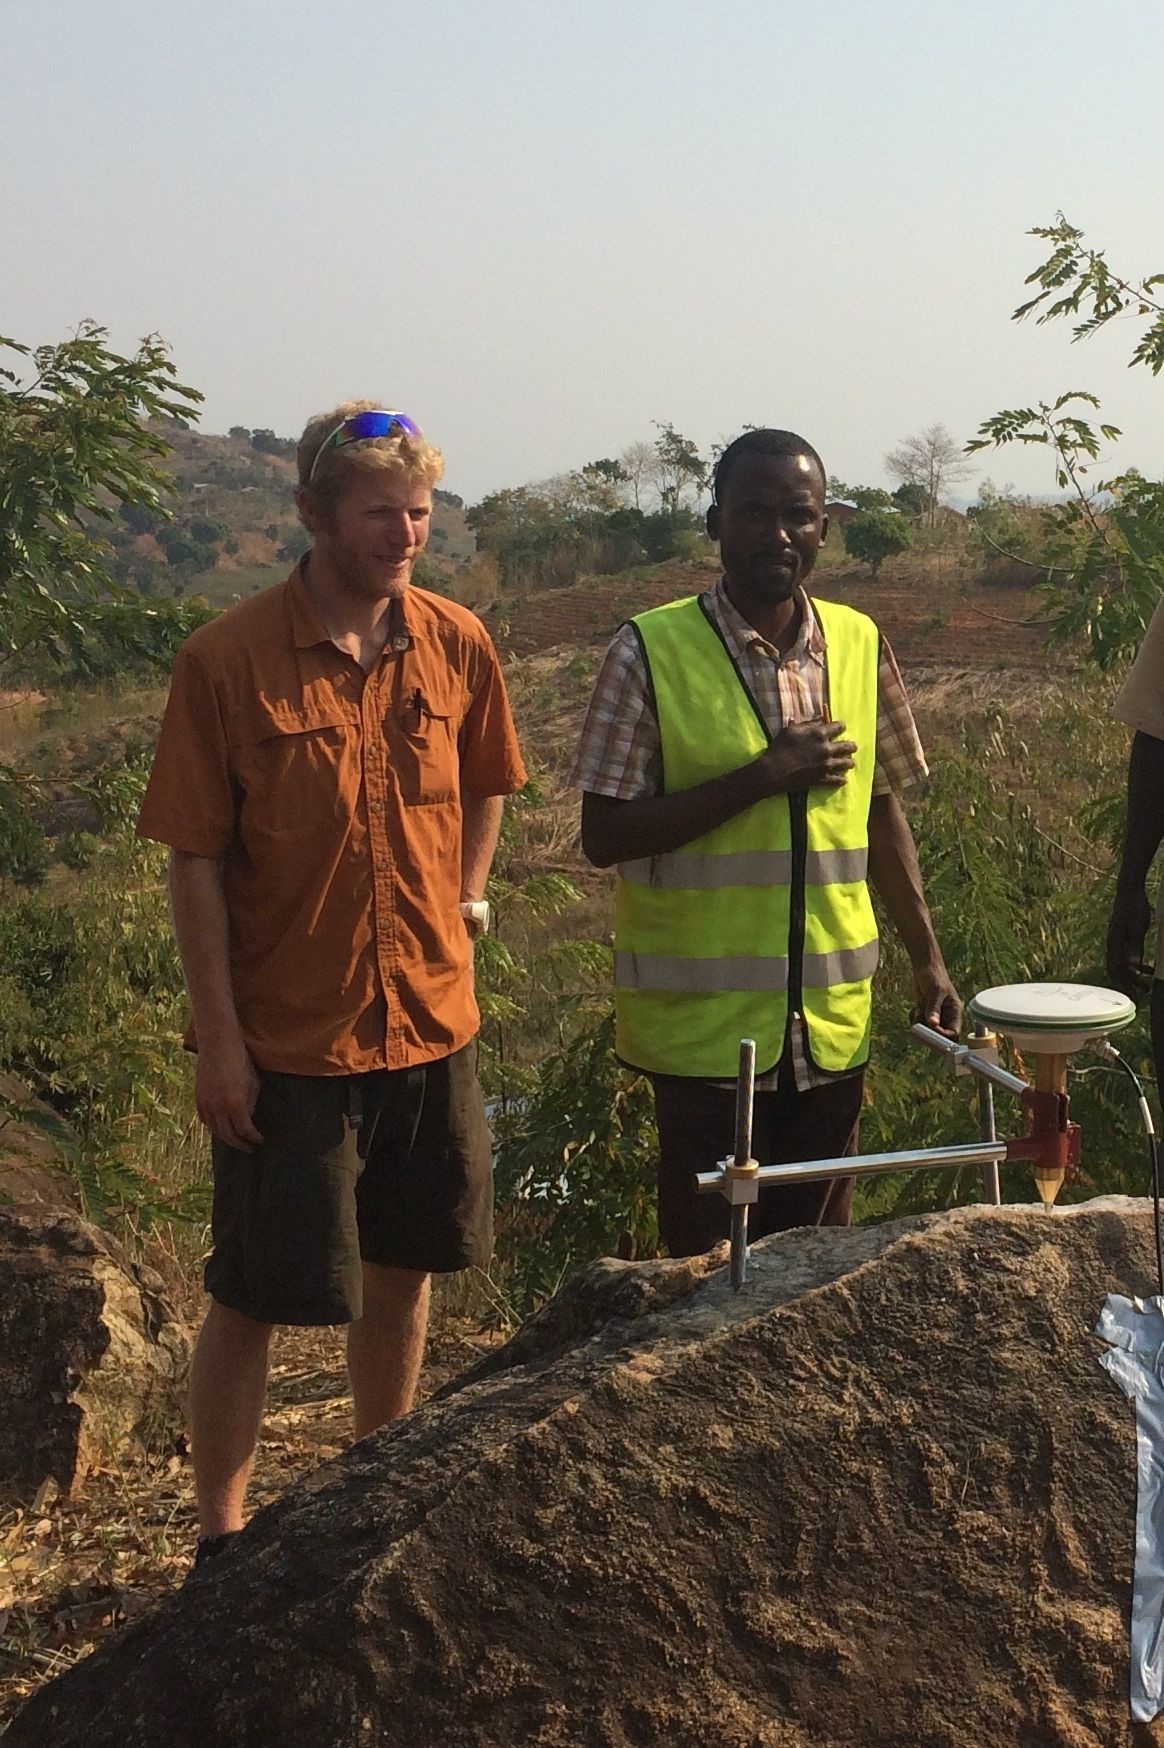
Ake Fagereng (Cardiff), Hassan Mdala (Geological Survey) and I covered nearly 5000 km in less than three weeks. Why would we do this to ourselves? To establish a baseline geodetic network at the southern tip of the East African Rift.
We want to know how strain is distributed, and which are the active structures. This latest field season is just another piece in the tectonic jigsaw that we hope will ultimately lead to improving earthquake resilience in developing countries.
Our partner for the last few years has been the Geological Survey Department of Malawi – in particular, Hassan, who operates a small mobile office in the back seat of the car. From here, he fixes all our problems, often before we even realize they exist; making use of a boundless network of friends and family, all of whom seem to be just waiting to help with our latest peculiar request.
Each GPS station is composed of an antenna, a receiver, a car battery, a regulator, a solar panel and a metal pin that we drill into the rock. Most of the kit only stays for 4 days, but we’ll need to re-measure the position of the pin for many years to come. In our search for suitable sites, we met many enthusiastic head teachers, police chiefs and district commissioners and one rather terrifying headmistress, all of whom helped with security arrangements in schools or telecommunications masts.
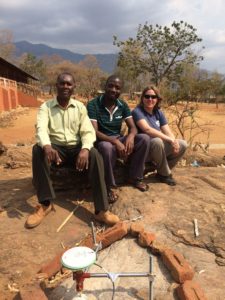
At Mua Primary school, with the Head Teacher, Deputy Head and our GPS antenna
Everywhere we went, there were spectacular landscapes and interesting geology, most of which we were forced to drive straight past. But so much of my research is done from satellites orbiting at 600 km that I can get a bit over-excited about getting my nose to the rock again, and we took advantage of what opportunity we had.
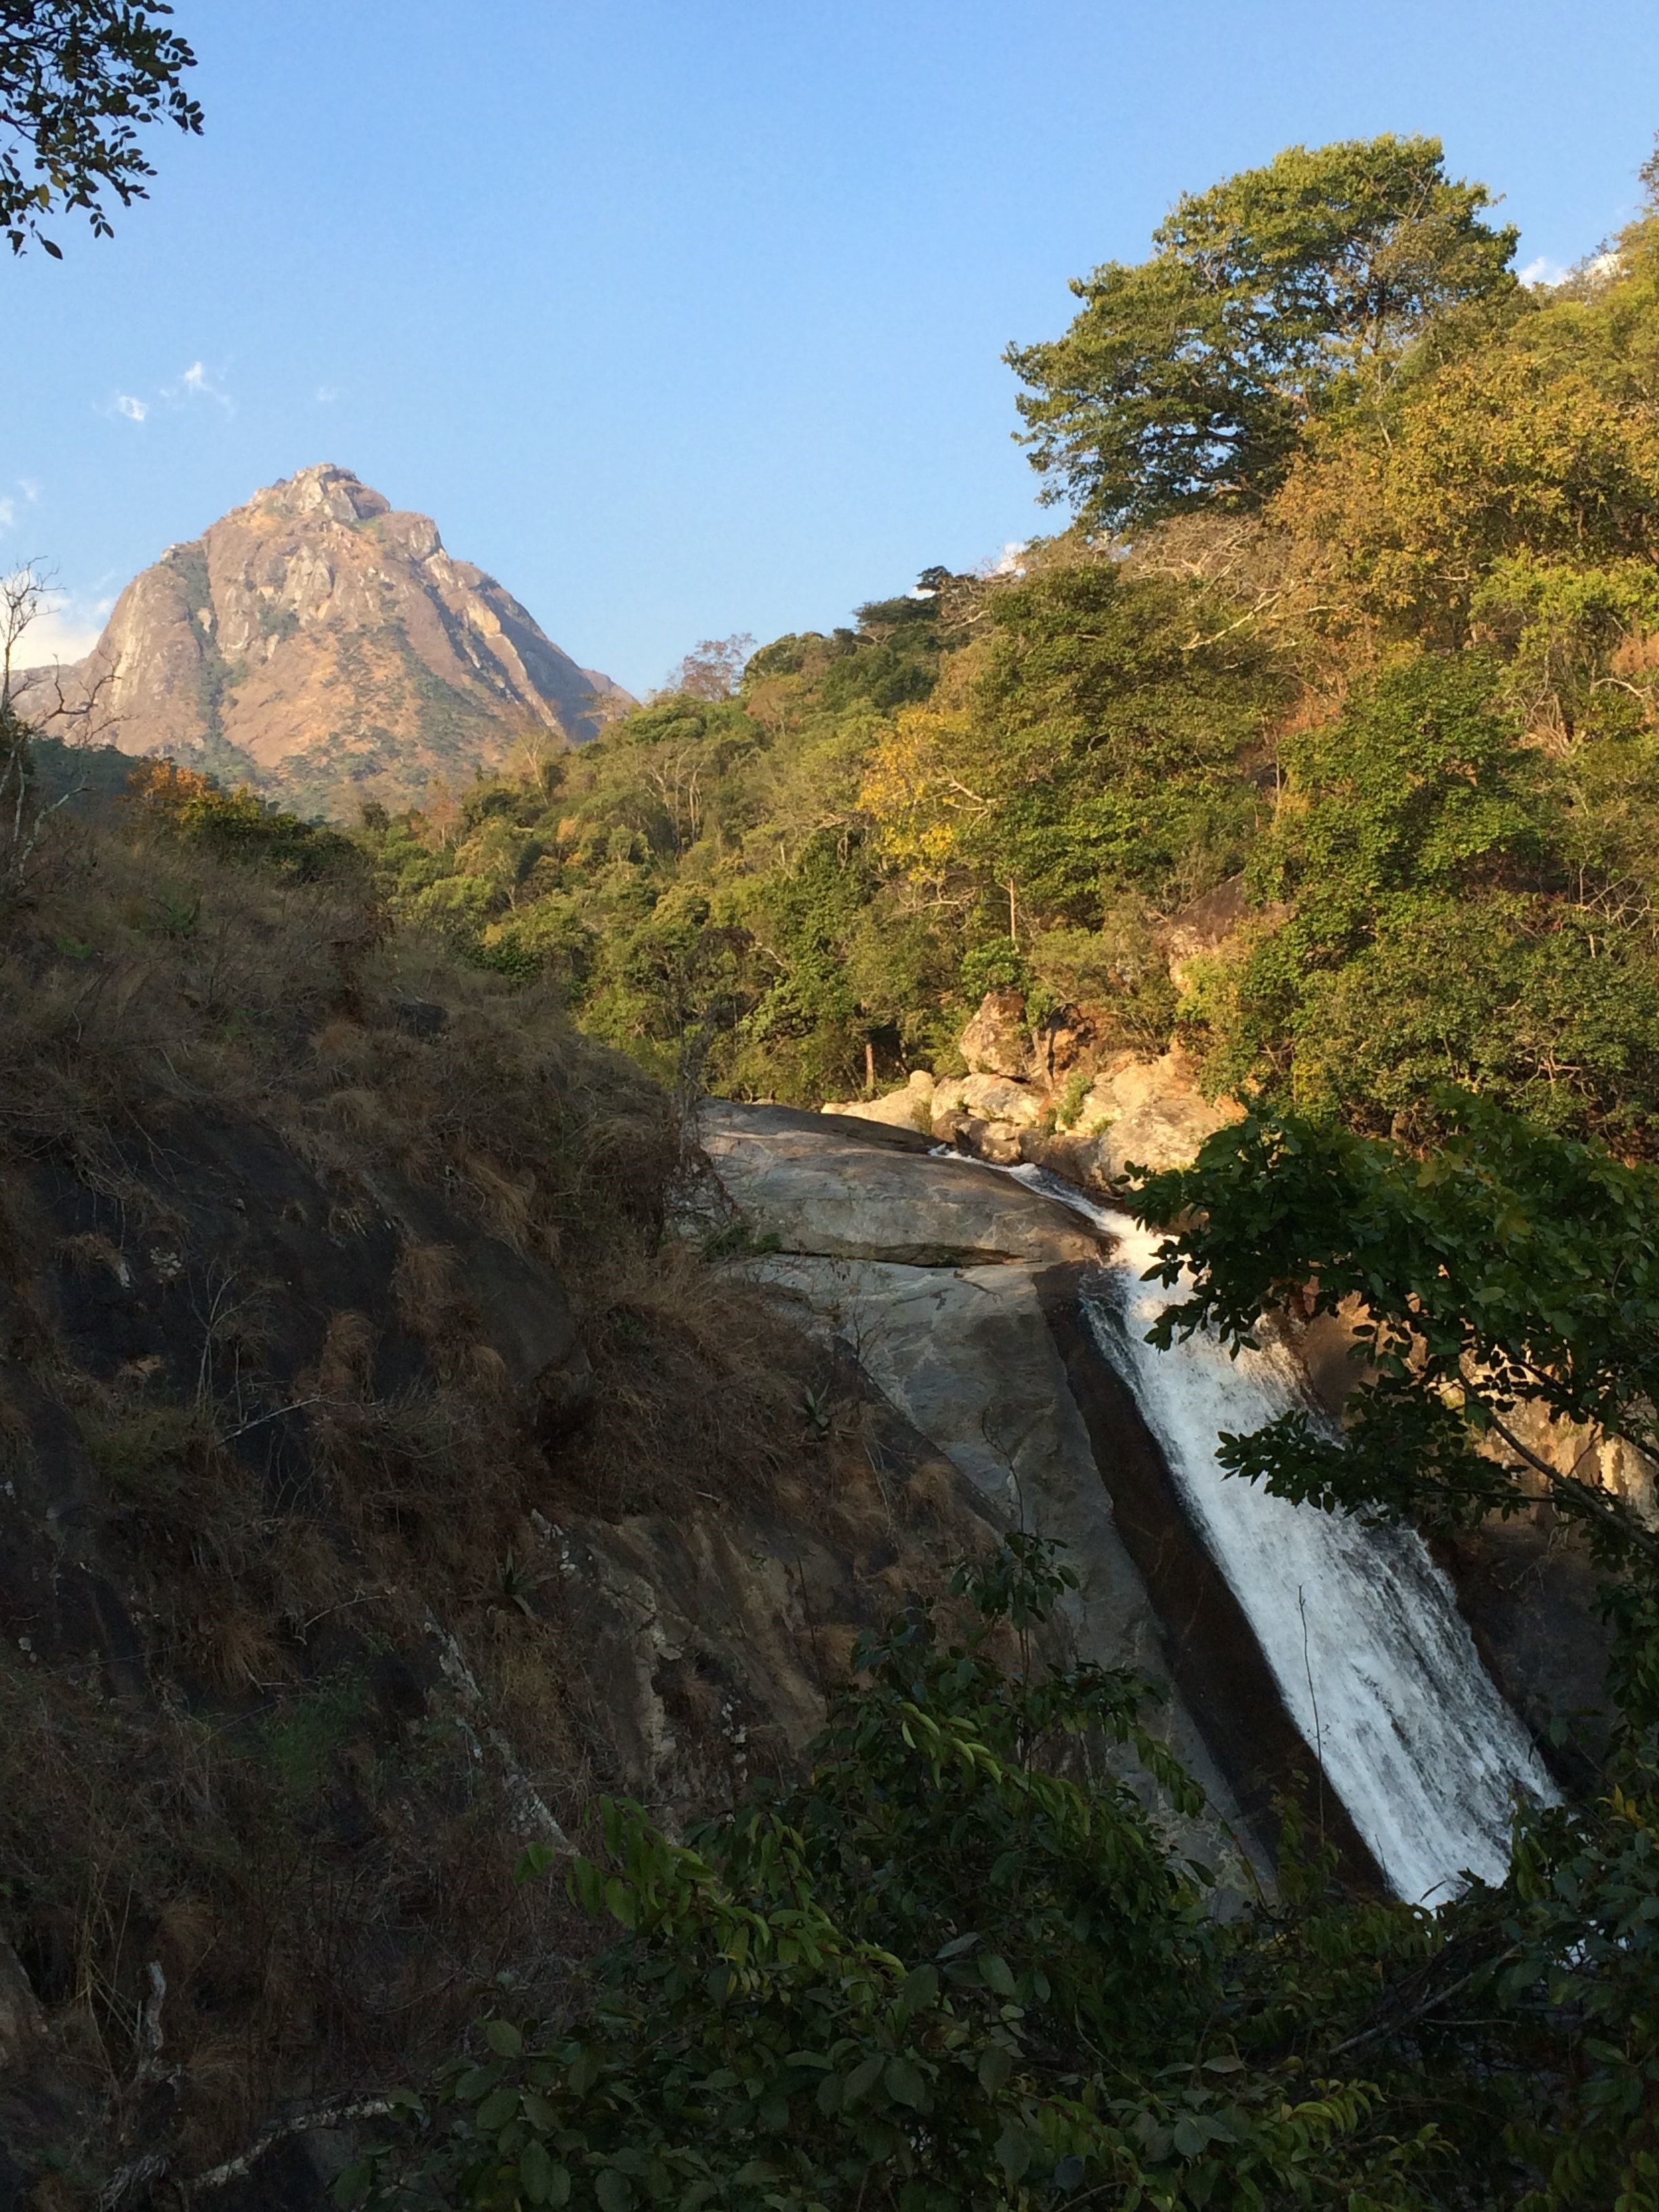
Malawi is largely composed of various types of gneiss, a high-grade metamorphic rock, with lots of migmatites, blobs that were once partially molten rock. Perhaps the most spectacular landscapes are the ‘inselbergs’, large granite intrusions, which now stick several thousand metres above the surrounding landscape. On our only day off, squeezed somehow into a hectic schedule, we hiked up the largest of these, Mulanje, for some truly spectacular views. We also found some fascinating faults, but you’ll have to wait for the paper to hear about those!
Hiking on Mulanje Massif. According to the Official Malawi Tourism site, the third largest mountain in Africa – a rather dubious statistic, but still steep enough to trouble my knees
Many people ask about the personal challenges to fieldwork in Africa, and there are indeed plenty of those: insect bites, the side-effects of malaria medication, power cuts, cold showers, endless meetings getting permission, long days driving over roads covered with pot-holes, goats, dogs, chickens and bicycles, and on this occasion a car break-in (I’m wondering if there’s such a thing as a frequent flyer card for local police stations…?).
But none of that matters much; I love every minute (well, almost, I could skip the police stations). A great trip requires great company: Hassan, for whom every minor disaster is ‘a learning opportunity’, and Ake whose response to the next challenge is usually ‘well, that’ll be fun’.
Ake and Hassan contemplating a job well done. ‘Til next time
All I can say, is I learned a lot and had fun doing it, so I guess they are both right. I simply feel privileged to spend time in a country with such interesting scientific questions, beautiful landscapes and warm, friendly people. I suspect we’ll find a way to come back before too long!
Our fieldwork was funded by Global Challenges Research Fund through an EPSRC Institutional Sponsorship Award to the University of Bristol; a BGS-COMET fieldwork award and a Researcher Mobility Grant from the World Universities Network.
COMET’s Marek Ziebart and Chris Atkins, both at UCL, have been using sidereal filtering to detect geohazards in near-real time. This article describes how they have applied this to earthquakes in the Aleutian Islands, Alaska.
Geodetic quality GPS (Global Positioning System) data – fundamentally high precision range measurements made between orbiting spacecraft and tracking stations, often rigidly attached to bedrock – is one of the key observables available to us to analyse plate tectonics and the earthquake cycle. Such tracking stations now often make measurements at 1 Hz or higher. This enables us to calculate high rate position time series for the tracking stations, revealing various kinds of motion related to seismic waves and other forms of deformation.
Figure 1: Deep braced GNSS tracking antenna at the Aleutian Islands, Cape Sarichef, Alaska (AV24-WestdahlNWAK2008). Credit: UNAVCO.org
One such time series is shown below, calculated by a standard processing method called PPP (precise point positioning). The plot shows the change in position in the north-south direction. When do you think the earthquake seismic waves begin to arrive?
Figure 2: 25 minutes of the 1Hz GPS time series for AV24 – a deep braced GNSS antenna on the Aleutian Islands, Cape Sarichef, Unimak Island, Alaska at the time of the 2011 Tohoku earthquake (WestdahlNWAK2008)
GPS Seismology
How can we use this type of data? The time series in figure 2 shows an estimate of the GPS antenna movement in the North-South direction during the 2011 magnitude 9.0 Tohoku earthquake over a period of 25 minutes. This is a measurement of the ground shaking – the data is used to understand the nature of the earthquake and to compare it to other earthquakes in different places around the world. Earthquakes often cause a change in the shape of the ground that is retained after the earthquake is over, and which can be determined from a time series. This kind of information can be used to estimate the size of the earthquake, how much energy was released and tells us about the earthquake’s epicentre location.
Another kind of instrument, a seismometer, can be used to determine similar information. The drawback of seismometers is that they can ‘clip’ when the seismic waves become too large to handle. A GPS antenna, on the other hand, has no such limitation – no matter how big the amplitude of the seismic waves, they can still be measured using GPS technology. Because of this, GPS antennas such as the ones shown in figures 1 and 6 below are sometimes called broadband GPS seismometers. In practice we combine information from both GPS antennas and seismometers – they are complimentary. There are now thousands of such GPS antennas installed around the world, connected to the internet and taking measurements 24 hours a day.
Figure 3: an example of a GPS tracking station network – this one is in the Gulf of Alaska and forms part of the US Plate Boundary Observatory (PBO)
So what’s the problem? The problem is Multipath – this is akin to radio interference where the signals transmitted by the orbiting satellites have more than one way of getting to the antenna. The strongest, direct signal – which is the one we want to measure – is distorted by signals bouncing off adjacent reflecting surfaces in the antenna’s vicinity. This causes spurious patterns of motion in the receiver time series. These can vary rapidly over a few seconds in a noise-like way (with amplitudes at the few mm level), or they can appear as a random walk – a slowly varying position error (with changes at the level of a few centimetres). Both these effects limit our ability to use GPS data for seismometry. To get some feel for the effect consider Figure 4.
On the day of the earthquake (shown as the black time series) the onset of the arrival of the largest seismic waves is shown clearly at around 6:03:00. A not dissimilar signature is also visible around 5:50:00. However, that same signature (an apparent ground movement of some 25mm over a few minutes, shaking and then reducing in magnitude) is visible at almost the same time on the previous day (in the grey time series). It doesn’t mean the earthquake was repeating – these are multipath distortions. They appear indistinguishable from seismic waves. Our problem, then, is how to remove the spurious, apparent motion from the time series, whilst retaining the actual signature of the earthquake. So what’s the solution?
Figure 4: the GPS time series (North-South component) for station AV24 on the day of the earthquake and on the day before. The time series on the vertical axis are offset by 60mm for clarity
Sidereal Filtering
Sidereal filtering is a technique used to reduce errors caused by multipath in the positioning of GPS receivers. It relies upon the receiver remaining static from one day to the next relative to its surrounding environment and takes advantage of the ground track repeat time of the GPS satellites, which is just less than a sidereal day (usually around 23 hours, 55 minutes, 55 seconds). The repeating multipath error can thus be identified and largely removed from the following day by subtraction.
A conventional position-domain sidereal filter (PDSF) identifies and removes this repeating pattern from a position time series. However, the ground track repeat time of individual GPS satellites can differ from each other by a few seconds, whereas a PDSF has to assume that all satellites have the same repeat time. This can cause problems for the PDSF, especially when the oscillations caused by multipath interference are particularly high. We have developed an observation-domain sidereal filter (ODSF) that identifies and removes multipath errors from the GPS phase measurements themselves.
Unlike the PDSF, it can account for the fact that the ground track repeat times of the GPS satellites differ by a few seconds from one another. This means that it is more effective at removing the effects of high-frequency multipath error and is less sensitive to satellite outages. For each phase measurement, the ODSF algorithm searches for an appropriate correction based on the azimuth and elevation of the relevant satellite. That correction is derived from the measurement residuals on the previous day that most closely correspond to that azimuth and elevation. The precision of these measures of azimuth and elevation needs to be high – a hundredth of a degree or better. This is readily achievable in our algorithm.
Figure 5: The same GPS time series for station AV24, but with the time series resulting from the two types of sidereal filter also shown. The time series on the vertical axis are offset by 50mm for clarity
Figure 5 shows the same 25-minute time series of 1 Hz displacements in northing as shown in Figure 4. Also plotted in red and green are the time series that result after applying the two types of sidereal filter: the PDSF and ODSF respectively. Notice that both the PDSF and the ODSF are largely successful at removing these oscillating errors. They reveal a surface wave arrival time of about 06:00 with the largest Love waves arriving at around 06:03. These events would not have been so easy to distinguish in the original unfiltered time series.
Figure 6: Deep braced GNSS tracking antenna on the Aleutian Islands, Cape Sarichef, Unimak Island, Alaska (AV27-WestdahlSWAK2008). Credit: UNAVCO.orgFigure 7: GPS time series for station AV27 including those resulting from the two types of sidereal filter. The time series on the vertical axis are offset by 50mm for clarity
Figure 7 similarly shows 1 Hz displacements at station AV27 which is only 11 km from AV24. One would therefore expect a very similar displacement signal. However, it is clear that the standard PPP time series, plotted in black and grey, are severely affected by strong short-period (~11 s) multipath error. In this case, the PDSF was unable to remove such a high-frequency error and instead increased the amplitude of these oscillations. The ODSF on the other hand was far more effective because it could take into account the differing repeat times of the satellites.
Conclusions
The precision of GPS technology has improved dramatically since 1995 when the system reached FOC (full operational capability). It is an effective tool for measuring geohazards and other geophysical phenomena in near real-time. However, data processing and interpretation must be handled carefully. Multipath effects on position time series can introduce spurious signatures that resemble seismic events and hamper our ability to exploit the technology. Sidereal filtering offers a very effective way to clean up GPS positioning time series to reveal more clearly geophysical events, effectively in real-time.
An international team of scientists, led by COMET’s John Elliott, has shed new light on the earthquake that devastated Nepal in April 2015, killing more than 8,000 people.
In a study published in the journal Nature Geoscience, the scientists show that a kink in the regional fault line below Nepal explains why the highest mountains in the Himalayas are seen to grow between earthquakes.
Dr Elliott explained: “We have shown that the fault beneath Nepal has a kink in it, creating a ramp 20km underground. Material is continually being pushed up this ramp, which explains why the mountains were seen to be growing in the decades before the earthquake. The earthquake itself then reversed this, dropping the mountains back down again when the pressure was released as the crust suddenly snapped in April 2015.
“Using the latest satellite technology, we have been able to precisely measure the land height changes across the entire eastern half of Nepal. The highest peaks dropped by up to 60cm in the first seconds of the earthquake.”
Mount Everest, at more than 50km east of the earthquake zone, was too far away to be affected by the subsidence in this event.
The team, which included academics from the USA and France, also demonstrate that the rupture on the fault stopped 11km below Kathmandu. This leaves an upper portion that remains unbroken and will build up more pressure over time as India continues to collide with Nepal, and indicates that another major earthquake could take place within a shorter timeframe than the centuries that might be expected for the area.
Dr Elliott added: “As this part of the fault is nearer the surface, the future rupture of this upper portion has the potential for a much greater impact on Kathmandu if it were to break in one go in a similar sized event to that of April 2015.
“Work on other earthquakes has suggested that when a rupture stops like this, it can be years or decades before it resumes, rather than the centuries that might usually be expected.”
Study co-author Dr Pablo González, from the School of Earth and Environment at the University of Leeds and also a COMET member, said: “We successfully mapped the earthquake motion using satellite technology on a very difficult mountainous terrain. We developed newly processing algorithms to obtain clearer displacement maps, which revealed the most likely fault geometry at depth to make sense of the puzzling geological observations.”
COMET researchers have unravelled a complex seismic sequence using a combination of techniques, explaining not only the earthquake sequence itself but also the formation of the mountain range where it occurred.
On August 18 2014, an Mw 6.2 earthquake struck Murmuri, near Dehloran in the Zagros Mountains of South West Iran (Figure 1), and was followed by five aftershocks of Mw of at least 5.4. The largest of these was a Mw 6.0 aftershock which took place 16 hours after the main event.
These were the first large seismic events in the region since important developments in satellite Earth Observation (EO) have allowed us to study earthquakes in unprecedented detail, providing the potential to combine a range of satellite-based and seismological approaches.
The study team, which included COMET scientists from Cambridge and Oxford along with colleagues from Iran, Colorado, and Canada, saw this as an opportunity to shed light not only on the Murmuri earthquake but also on how the Zagros Mountains themselves are evolving.
Figure 1 below shows the distribution of earthquakes in the region along with the 2014 Murmuri event.
Figure 1: Earthquakes and topography of the Zagros Mountains. White circles show events of magnitude 5.0 and larger (Nissen et al., 2011). The red star shows the Murmuri mainshock.
The depth of the earthquake-generating thrust faults in the Zagros Mountains has been the subject of debate for some time. Previous studies have disagreed on whether the faults break a thick sequence of sedimentary layers, or are confined to the underlying crystalline rocks.
Importantly, rather than using a single technique, the team combined satellite-based EO techniques with studies of the seismic waves generated by the earthquake and aftershocks. The first step was to identify their locations, which was crucial to understanding the relationship between the ground motions detected by InSAR and the fault planes that caused the earthquakes. They then used the results to generate models of the faults.
Modelling the seismic waves showed that all except one of the events were caused by thrust faults. The smooth signals in the InSAR interferograms meanwhile showed that the faulting which led to the earthquake was buried deep under the surface.
Figure 2: Interferograms of the 18 August 2014 earthquake. Each interferogram is labelled with the dates of the two SAR acquisitions in the format YYYYMMDD, and the background shading is the topography.
The next question was whether the earthquakes had been caused by a single or multiple faults. The interferograms showed distinct lobes extending to the east and southeast of the main affected area, suggesting that the displacements on the surface were caused by two if not three separate faults.
COMET’s Alex Copley, from the Department of Earth Sciences at the University of Cambridge, explained: “ We found that a single-fault model couldn’t reproduce the deformation patterns shown by the interferograms, so we investigated by applying multiple-fault models instead.”
The team modelled the faults to establish characteristics including their direction, length and angle. When they used the interferograms alone there were a wide range of different fault parameters that could produce models that matched the data, but by including the seismic data the team could narrow down these characteristics.
Dr Copley added: “The only way we managed to work out what actually happened was by using seismological techniques, and then using these results to interpret the satellite measurements.”
The results showed that the 18 August 2014 event involved significant slip on two planes, which produced a complex displacement pattern in the InSAR, and that there were two separate events big enough to produce surface deformation signals, hence the two lobes on the interferograms.
It also became clear that most if not all of the faulting took place in the sedimentary layers rather than the igneous rocks below, at depths of 3-9km. The faults were also found to be longer than they were deep, which is relatively unusual – most faults tend to be more or less equal in length and depth. This could be because changes in the mechanical properties of the rocks below stop the faults from extending any deeper.
As well as explaining the events at Murmuri, the results throw light on the large scale tectonics of the Zagros Mountains, showing which combination of tectonic forces and material properties of the rocks can give rise to the shape and deformation pattern of the mountain range.
Dr Copley summarised: “If we had used seismology or satellite measurements alone we would have failed to learn much that was new about this earthquake sequence. Instead, our approach allowed us to shed light not only on the formation of the Zagros, but also how similar fold-thrust belts form across the globe.”
Active faults and the devastating earthquakes they can trigger do not respect political borders. Whilst the recent earthquakes in Nepal did most damage to the mountain kingdom itself, hundreds of people were also killed or injured in neighbouring China, India and Bangladesh.
The region’s history tells a similar story – the three countries’ earthquake records over the last 500 years are intertwined by shared proximity to the Himalayan mountain belt and its underlying megathrust fault.
Ways of improving resilience to earthquake hazard also need to transcend political boundaries, bringing together scientists and policymakers from the affected countries to share knowledge, experience and ideas.
This principle has led to the Earthquakes without Frontiers (EwF) partnership – a diverse group of natural and social scientists from around the UK. Led by James Jackson of both COMET and the University of Cambridge, EwF is a 5-year initiative funded by NERC and ESRC (the Natural Environment and Economic and Social Research Councils) under the Improving Resilience to Natural Hazards programme.
As well as COMET, the partnership includes researchers from Cambridge, Durham, Hull, Leeds, Northumbria and Oxford Universities, the British Geological Survey, the Overseas Development Institute and Durham’s Institute of Hazard, Risk and Resilience.
The project focuses on three broad regions – China, the Himalayan mountain front (Nepal and Northern India) and Central Asia (Kazakhstan and Kyrgyzstan) – with the key objective of furthering knowledge on earthquakes and landslides in the continental interiors.
Much of this involves using remotely sensed data which complements the project’s cross-border approach. EwF scientists use digital topography and multispectral and optical imagery to research landslide hazard and map active faults, alongside satellite radar to measure the warping of the Earth’s crust and steady interseismic motions as faults build up stress before the next seismic event.
All of this contributes to a wider programme of social and natural scientific research with scientists in the partner countries, as well as being used to run workshops and training events for young international scientists.
Crucially, this knowledge exchange extends to countries dealing with similar hazards – the same types of fault that threaten vast regions in China also cause earthquakes in Italy, and lessons learnt about Iranian faults can inform work on hazard in Kazakhstan and vice versa. As such, EwF brings together scientists from many countries to share knowledge and experience across an even wider network, culminating in the annual EwF partnership meetings, the most recent of which was held in Kathmandu in April 2015.
When a huge Mw7.8 earthquake struck Nepal on the 25th April, it came as a double blow to all within EwF. Nepal is not only one of our focus areas, but many of the UK team also had been in Kathmandu just one week before the earthquake, working and living alongside Nepali colleagues and friends.
The International Charter for Space and Major Disasters was invoked just 3 hours after the earthquake, and over the following few days, space agencies hurriedly tasked their satellites to acquire new imagery over Nepal. We all felt strongly that we should put our combined experience to good use in the immediate aftermath of the Nepal earthquake, and dashed to obtain satellite imagery of the area. In the weeks since we have been working to analyse this imagery in order to aid both disaster relief efforts and hazard re-evaluation.
Figure 1: Satellite radar interferogram of the 25 April 2015 Mw7.8 Nepal Earthquake. The coloured fringes represent contours of ground motion towards the satellite, at intervals of 8.5 cm. Image credit: Pablo Gonzalez, University of Leeds, EwF, LiCS; SAR data provided by the European Space Agency
EwF researchers, along with colleagues at the University of Leeds, used data from the European Space Agency’s Sentinel-1A satellite to measure how the ground was permanently warped by the earthquake. This was greatly assisted by COMET’s new automated processing facility, designed to cope with the vast amount of data from the Sentinel-1 satellites, which helped to produce some of the first radar interferograms of the Nepal earthquake. These mapped how the ground was warped along a 170 km stretch of the fault, moving by up to ~1.4 m near Kathmandu.
We are now modelling the data to understand how the fault slipped at depth, establish the relationship with the large Mw 7.3 aftershock on the 12th May, and gauge how these events may have stressed the surrounding regions, making them more likely to fail in future.
At the same time, EwF scientists at Durham University and the British Geological Survey have been using high-resolution optical and multispectral imagery to map landslides in the region. We have identified around 3,600 landslides that were either triggered or reactivated by the earthquake, using the maps to show where rivers are likely to be dammed and roads blocked. This has also highlighted the need to plan for the monsoon season which may reactivate or trigger even more deadly landslides.
Figure 2: Landslide map. Colour scale shows landslide intensity, with blue ~ 1 landslide/km2 and red ~29 landslides/km2. ( http://ewf.nerc.ac.uk/2015/05/28/nepal-updated-28-may-landslide-inventory-following-25-april-nepal-earthquake/) Image credit: University of Durham, EwF, BGS. Satellite data have been provided via the International Charter for Space and Major Disasters and freely available online viewers: WorldView @ Digital Globe; USGS LandSat8; Bhuvan RS2; Astrium Imagery; Google Crisis. Vector data: OSM. Digital Elevation Model: ASTER
Over the coming months, EwF researchers will continue to work on these topics as well as the many more questions raised by the Nepal earthquake. We hope that the lessons learned from this terrible event will bring us one step closer to improving resilience to future earthquakes, not just for Nepal and the countries across its borders, but for all earthquake-prone countries.
In 2013, a MW7.7 earthquake struck Balochistan, caused a huge surface offset and triggered a small tsunami in the Arabian Sea.
The apparently strange fault behaviour attracted the attention of scientists worldwide and discussion is still ongoing.
This an interesting case for paleoseismologists, not only because of the cascading earthquake effects, but also because of the surface rupture distribution, from which we might learn some important lessons.
COMET student Yu Zhou and his colleagues from Oxford University have published a new paper on this event, arguing that it might be not as unusual as it seems. Their research is based on the analysis of Pleiades stereo satellite imagery, which has proven to be a very useful data source.
On 25 April, a 7.8-magnitude earthquake struck Nepal, claiming over 8,000 lives and affecting millions of people.
Images from ESA’s Sentinel-1A satellite clearly showed the effects of the earthquake, including the maximum land deformation only 17km from Nepal’s capital, Kathmandu. This explains the extremely high damage to the area.
Nepal earthquake April 2015. Credit: Copernicus data (2015)/ESA/Norut/PPO.labs/COMET–ESA SEOM INSARAP study
By combining Sentinel-1A imagery from before and after the quake, COMET scientists have been able to interpret the rainbow-coloured interference patterns in the image (known as an interferogram), and interpret them as changes on the ground. COMET scientists have also been analysing the 12 May aftershock. You can read more here.
COMET scientists have been closely involved with international efforts to analyse satellite data from the recent Nepal earthquake.
Combining two Sentinel-1A radar scans from 17 and 29 April 2015, this interferogram shows changes on the ground that occurred during the 25 April earthquake that struck Nepal. An overall area of 120×100 km has moved – half of that uplifted and the other half, north of Kathmandu subsided. Vertical accuracy is a few cm. Credit: Copernicus data (2015)/ESA/Norut/PPO.labs/COMET–ESA SEOM INSARAP study
You can read more about the Sentinel-1A interferogram on the ESA website.
Links to some of the broader media coverage of our work can be found below.