Tag Archives: volcanic deformation

Intrusive activity at Cerro Azul Volcano, Galápagos Islands (Ecuador)

Cerro Azul is the southernmost active volcano on Isabela Island, Galápagos (Ecuador). On 18-19 March 2017, seismic activity increased on the SE flank of the volcano.

On the same day, the Instituto Geofisico Escuela Politécnica National (IGEPN), the organisation responsible for the monitoring of Ecuadorian volcanoes, issued a warning for a possible imminent eruption.

The recorded seismicity was composed of volcano tectonic (VT) earthquakes, consistent with processes of rock fracturing, with the majority of the events having magnitude ranging between 2.4 and 3.  There were also sporadic events with magnitude up to 3.6 (see the second activity update released by IGEPN on 24 March).

The Sentinel-1 satellite acquired synthetic aperture radar data on 7  and 8 of March, prior to the onset of the seismic activity, and on 19 and 20 March, once seismicity started to exceed background levels both in terms of number of earthquakes and of energy release.

Applying SAR interferometric techniques (e.g. InSAR) showed significant deformation (up to 14 cm) in the region affected by the seismic swarm. More specifically, the InSAR data shows uplift at the southeastern flank of the volcano and contemporary subsidence centered at the summit of the volcano.
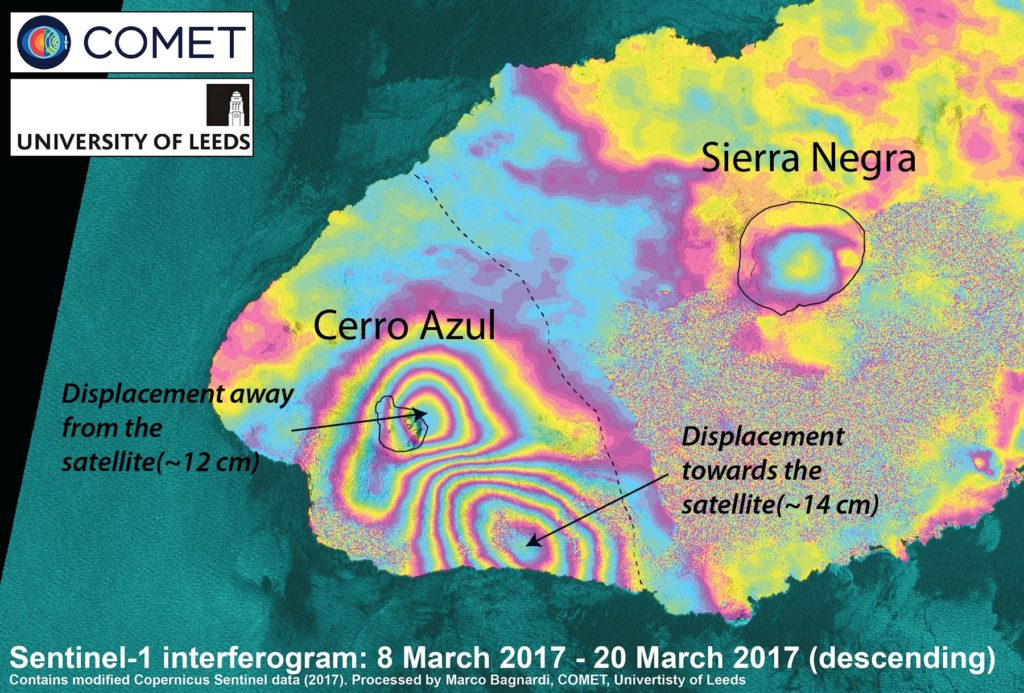
Sentinel-1 interferogram showing deformation caused by the magmatic intrusion as of 20 March 2017. Each color fringe corresponds to ~2.8 cm of displacement in the direction between the ground and the satellite.

COMET researcher Marco Bagnardi, working with the IGEPN, carried out a preliminary analysis of the InSAR data and observed that the deformation (at least as of 20 March 2017) can be explained by the intrusion of a 20-40 million cubic meters sill at a depth of ~5 km beneath the surface of the volcano.
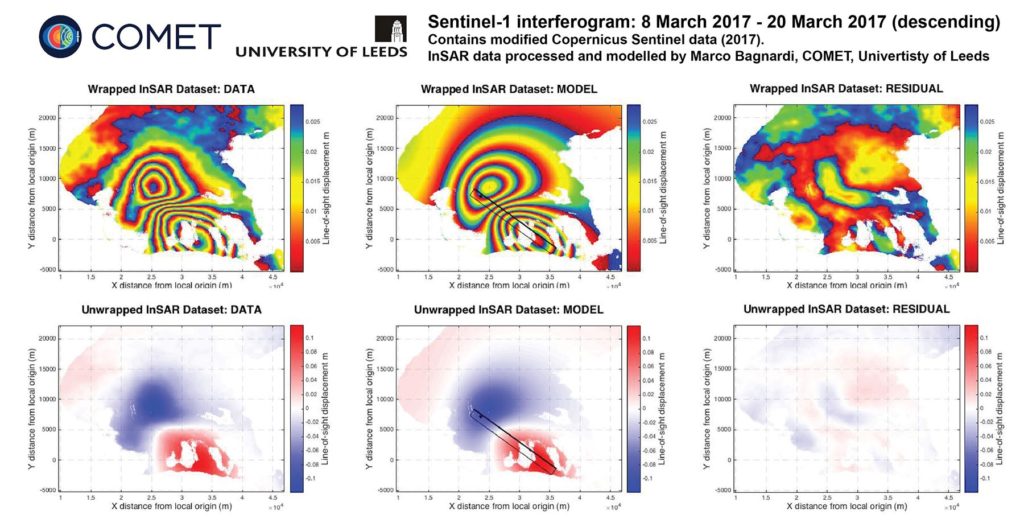
Modelling results from the inversion of InSAR data. The proposed model is composed of a horizontal sill intrusion at ~5 km depth (black rectangle) fed by a deflating source at ~6 km depth (black star).

Such intrusion is likely to be fed by a 6 km deep reservoir, cantered beneath the summit of the volcano. The location of the intrusion well matches the location of the seismicity recorded by IGEPN.
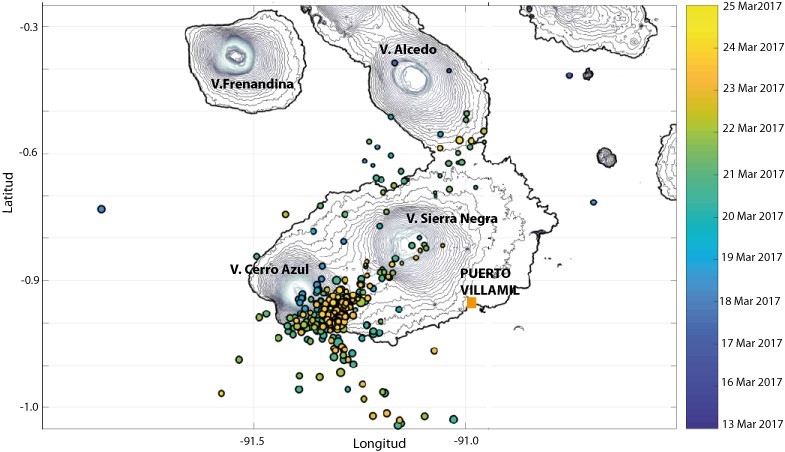
Earthquake locations between 13 and 25 March 2017. Credit: IGEPN “Informe Especial Cerro Azul No. 2 – 2017”.

Marco Bagnardi said: “Within ten hours from receiving the warning from IGEPN, we were able to get hold of the most recent Sentinel-1 data for the area, process them to form differential interferograms, invert the data to infer the source of the observed deformation, and pass on the information to our Ecuadorian colleagues.”

The seismic activity seems to be continuing today.  IGEPN is currently proposing two possible scenarios for the evolution of this episode of volcanic unrest:

  • the intrusion could reach the surface and feed an effusive eruption in the coming days or weeks, as happened in 1998 and 2008; or
  • seismic activity and deformation could return to background level without the eruption of magma at the surface.

The next Sentinel-1 acquisitions will be on 1 and 2 April.  They will hopefully shed more light on the nature of the magmatic intrusion and on its evolution since 20 March.



Iceland volcano collapse explained

COMET scientists have helped to shed new light on how volcanoes collapse during major eruptions, in new research published in Science.

The study, led by the University of Iceland, investigated a recent collapse at Bárdarbunga Volcano, Iceland, during the biggest volcanic eruption in Europe since the huge event at Laki in 1784.

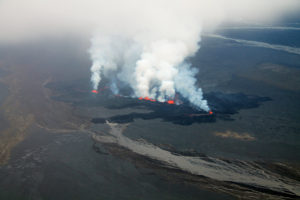
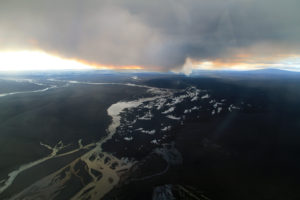
Eruption column and lava flow from the air on 22 September 2014. Credit:Thórdís Högnadóttir
Eruption column and lava flow from the air on 22 September 2014. Credit: Thórdís Högnadóttir

The largest eruptions on Earth are commonly associated with collapse of the roof of a volcano into a magma chamber below. As they are infrequent, however – only five caldera collapses were recorded during the twentieth century – the processes involved are poorly understood.

The Bárdarbunga eruption, which lasted from August 2014 until February 2015, produced 1.5 km3 of basaltic lava.  In the course of the eruption, the top of the volcano caldera gradually sagged downwards, leaving an elongated bowl shaped depression over 13 km long and up to 65 m deep.

Bárdarbunga from the north, showing the main subsidence bowl within the caldera. Credit: Magnús T. Gudmundsson

The total volume of the subsidence was 1.8 km3 – similar to the total volume of lava erupted and injected into the crust , implying a strong link between the two.

COMET scientist Marco Bagnardi said: “We saw the events at Bárdarbunga as an opportunity to better understand caldera collapse, and used multiple techniques to investigate.”

COMET researchers used radar data from satellites to measure ground deformation at Bárdarbunga’s caldera over a number of 24 hour periods.  As the topography continually changed, these data revealed movement of faults that reached to within a kilometre or so of the surface.

Combined with other techniques, including airborne altimetry, high precision GPS, seismology,  radio-echo soundings, and ice flow modelling, the results were used to create a detailed picture and timeline of how the caldera was collapsing and why.

From 16 August 2014 – before the eruption began – magma had been migrating out of a chamber 12 km below the ground, forming a fracture in the Earth’s crust.  Continued monitoring during the event showed that the magma was moving sideways from the volcano, beneath the surface, before finally erupting at Holuhraun, 47 km to the northeast, two weeks later.

Bardarbunga dike
The eruption in Holuhraun on its fourth day (3 September 2014). Credit: Thórdís Högnadóttir

Further analysis showed that a few days after the initial migration, the outflow of magma activated faults around the edge of the caldera leading to a series of earthquakes, which marked the beginning of the caldera collapse.  The collapsing roof then acted like a piston forcing even more magma out of the chamber below, which in turn led to further collapse.

COMET scientist Professor Andy Hooper explained: “Through modelling many different data sets, we were able to show that the caldera collapse was caused by magma leaving the reservoir, and this in turn squeezed more magma out of the reservoir, forming a positive feedback. This mechanism led to much more magma being erupted than would otherwise have been the case, which explains how eruptions on an even larger scale can occur.”

Overall, between 12 and 20% of the magma had left the magma chamber when the caldera collapse began.

Summarising the research, Prof Hooper added: “This work has given us real insight into caldera collapse, not only at Bárdarbunga but also at even larger eruptions.  What’s particularly interesting is how the collapse of the magma reservoir and the flow out of it clearly amplify each other.”

The paper, available now in Science, is Gudmundsson et al. (2016) Gradual caldera collapse at  Bárdarbunga volcano, Iceland, regulated by lateral magma outflow, doi:10.1126/science.aaf8988.

Over what distances do volcanoes interact?

In the geological past, large eruptions have often occurred simultaneously at nearby volcanoes. Now, a team of COMET scientists from the University of Bristol uses satellite imagery to investigate the distances over which restless magmatic plumbing systems interact.

In a study published in the journal Nature Geoscience, the scientists use deformation maps from the Kenyan Rift to monitor pressure changes in a sequence of small magma lenses beneath a single volcano. Importantly, they find that active magma systems were not disturbed beneath neighboring volcanoes less than 15 km away.

The lead author, Dr Juliet Biggs, explained: “Our satellite data shows that unrest in Kenya was restricted to an individual system. Inter-bedded ash layers at these same volcanoes, however, tell us that they have erupted synchronously in the geological past. This was our first hint to compare observations of lateral interactions based on recent geophysical measurements with those from petrological analyses of much older eruptions.

The team, which includes a recently graduated PhD student Elspeth Robertson and Bristol’s Head of Volcanology Prof. Kathy Cashman, took this opportunity to compare observations from around the world with simple scaling laws based on potential interaction mechanisms. They found that stress changes from very large eruptions could influence volcanoes over distances of up to 50 km, but that smaller pressure changes associated with unrest require a different mechanism to explain the interactions.

Prof Cashman explained ‘Volcanology is undergoing a scientific revolution right now – the concept of a large vat of liquid magma beneath a volcano is being replaced by that of a crystalline mush that contains a network of melt or gas lenses. The interactions patterns observed in Kenya support this view, and help to constrain the geometry and location of individual melt and gas lenses.”

The study was funded by two major NERC projects: COMET, a world-leading research centre focusing on tectonic and volcanic processes using Earth observation techniques; and RiftVolc, which is studying the past, present and future behavior of volcanoes in the East African Rift.

The research paper, The lateral extent of volcanic interactions during unrest and eruption, was published online in Nature Geoscience on 15th February 2016.

Sentinel-1 satellite captures volcanic surface changes that reveal the flow below

Pablo Gonzalez’s work on the 2014 Pico do Fogo eruption has been featured in the AGU’s Eos magazine.

Pico do Fogo. Credit: Nicole Richter

The research uses a new satellite imaging system to model the subsurface path of the magma that fed the eruption, and shows that Sentinel-1’s TOPS InSAR technique has the potential to be used to study other natural hazards, including earthquakes and landslides.

Read the full article at EoS

COMET workshop on the modelling of magmatic processes

Around 20 scientists gathered at the University of Leeds recently to share their knowledge and their views on how magmatic activity can be understood and reproduced by models of volcanic processes.

Fourteen COMET members, including scientists, research staff and students, were joined by experts in various fields of volcanology from other world-leading institutions such as the United States Geological Survey, the University of Geneva and the University of Liverpool.

At the workshop we discussed the numerous challenges we face when we try to experimentally replicate natural processes such as those occurring at volcanoes. The most important limitation is that we can exclusively witness and measure what happens at the surface of the volcanoes, and only indirectly infer what goes on beneath them.

There are many different techniques commonly used to take the pulse of the magmatic activity: we measure how the volcanic edifices deform, we record seismic waves coming from and travelling through the magmatic systems, we collect and analyse lava and ash samples during eruptions, we measure the concentration of gases emitted by volcanic vents etc.

The rapid expansion and improvement of satellite Earth Observation (EO) techniques (such as radar interferometry to measure deformation, infrared atmospheric sounding to measure gas emissions etc.) offers further opportunities to study magmatic processes at a global scale.

Although each technique can shed light on one or more volcanic processes, the highest chance of truly understanding what controls the magmatic activity happens when all the measurements and information are analysed together.

The use of a multi-disciplinary approach was the key element of the COMET workshop and all participants agreed that future research in volcanology must move in this direction. Conceptual and numerical models of how magma is stored beneath the surface must be able to reconcile the observed deformation, the amount of gasses released in the atmosphere and the physical/chemical properties of the erupted products. Models of how magma reaches the surface during eruptions need to explain the seismic signature of magma ascent, be compatible with the mechanical properties of volcanic rocks, and consider magma as a multi-phase fluid containing gas, liquid and crystals.

During our workshop, we identified several potential research projects that will be developed in the coming months and that will imply the use of information from different disciplines of volcanology. For example, we aim to globally classify active volcanoes on the basis of their behaviours in terms of deformation and gas emissions. Much effort will also be put in understanding the characteristics of magma reservoirs, moving from conceptual models of simple liquid-filled cavities to complex, multi-phase, dynamic systems.

Finally, specific volcanoes where COMET scientists already have access to long records of geophysical, geochemical and petrological data (for example Soufriere Hills Volcano in Montserrat or Kilauea Volcano in Hawaii) will be used as natural laboratories. At these locations, we will test models that try to reproduce processes ranging from specific eruptive behaviours to long-term magma supply to the volcanoes.

For further information, contact Dr Marco Bagnardi m.bagnardi@leeds.ac.uk.

Sentinel-1A’s TOPS explains the 2014-15 Fogo eruption

COMET researchers have used the European Space Agency’s Sentinel-1A satellite to shed light on the 2014-15 eruption at Fogo, the most active volcano in the Cape Verde archipelago.

Their paper, published in Geophysical Research Letters, investigates the eruption using Sentinel-1A’s new radar acquisition mode, Terrain Observation by Progressive Scans (TOPS).

Fogo has erupted at least 26 times in the last 500 years, and this particular event lasted 81 days from November 2014 to February 2015.  It had devastating consequences for the island. Fast lava flows destroyed the villages of Portela and Bangaeria in early December 2014.

As the satellite had only been operating for a few weeks when the eruption began, this is the first study to use Sentinel-1A TOPS to investigate surface deformation associated with volcanic activity.

Lead author Dr Pablo J. González, from the University of Leeds, explained: “the study has given us a real insight into the inner workings of Fogo volcano.  It also shows the potential of Sentinel-1’s TOPS mode for monitoring volcanic activity in the future acheter du viagra.

Up until recently, the volcano had mostly been monitored by a GPS network with limited spatial coverage.  In comparison, the wide area and high spatial resolution of Sentinel-1A’s satellite images allowed the team, which included researchers from Norway, The Netherlands and Canada, to monitor ground deformation across Fogo.

Using the TOPS data, they found that during the eruption the ground surface had changed in a “butterfly” shape, characteristic for a dike intrusion (where the magma intrudes into a fissure, shouldering aside other the existing layers of rock).

Sentinel-1A ascending interferogram spanning the onset of the2014-2015 Fogo eruption (3 – 27 November 2014). Each colour fringe represents ~3 cm of ground displacement.  
Sentinel-1A ascending interferogram spanning the onset of the2014-2015 Fogo eruption (3 – 27 November 2014). Each colour fringe represents ~3 cm of ground displacement.

Models created to reproduce the observed data then showed that first of all the magma moved rapidly from depths of more than ten kilometres below the volcano’s summit.  It then moved along the dike to feed the eruption at a fissure on the southwestern flank of the volcano’s summit cone, rather than from its top.

This was backed up by the satellite data showing a lack of deformation across the whole island during the eruption, which would have suggested that it was instead being fed by an inflating/deflating magma reservoir directly beneath.

The findings will now set the direction for further research aimed at understanding the pattern of eruptions on the island, as well as assessing the stability of the entire volcanic structure.

Dr Marco Bagnardi, COMET researcher, and also co-author in this paper, added: “Our results not only show the importance of near-real time ground deformation monitoring at Fogo, they also demonstrate the potential of Sentinel-1A’s TOPS mode for monitoring geohazards more widely.”

The full paper, The 2014-2015 eruption of Fogo volcano: geodetic modelling of Sentinel-1 TOPS interferometry, is available now in Geophysical Research Letters.

COMET scientists analyse Calbuco eruption

On 22nd April Calbuco volcano, Chile, erupted for the first time since 1972 with very little warning. Plumes of volcanic ash reached heights of 16 km on the 22nd and up to 17 km in a second, longer eruption that began in the early hours of 23rd April.

Several thousand people were evacuated from villages closest to Calbuco , and ash fell over an area extending from the west coast of Chile to the east coast of Argentina, and grounded air traffic in Chile, Uruguay and Argentina.

COMET scientists have been using satellite data to analyse the event, in terms of both the emissions and changes to the shape of the volcano itself.  You can read more about the event here.

Figure 4. Data, spherical source elastic half space model and residuals for recent deformation at Calbuco [Bagnardi].
Data, spherical source elastic half space model and residuals for recent deformation at Calbuco [Bagnardi].