Work led by COMET scientists Juliet Biggs and Andy Hooper is developing new methods for using artificial intelligence and satellite data monitor and potentially help predict volcanic eruptions.
Their work is described in a Nature article, published on 7 March 2019, which outlines how Juliet’s team at Bristol is using satellite imagery from the European Space Agency Sentinel-1 mission, alongside machine learning, to spot the formation of ground distortions around volcanoes.
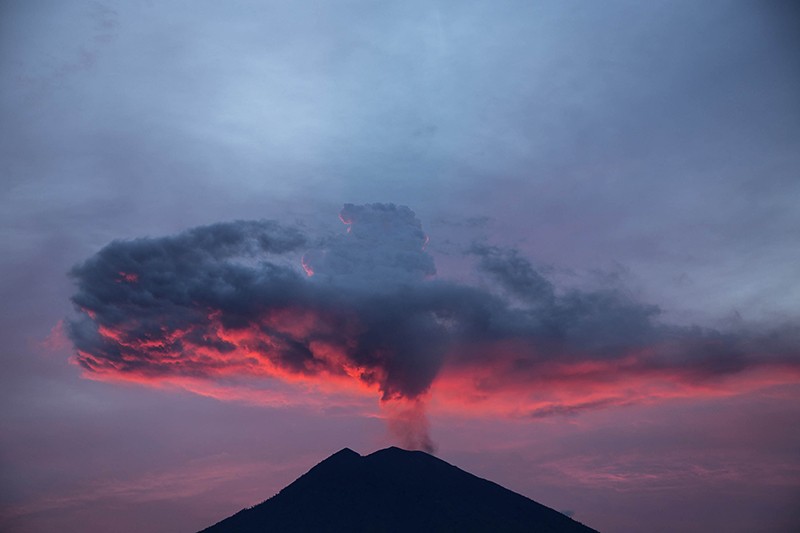
Agung volcano on the Indonesian island of Bali erupts in November 2017. Credit: Donal Husni/Zuma
Meanwhile at Leeds, Andy’s team is using a technique that searches for changes in the satellite data. Where the ground around a volcano is deforming, their method can flag if the distortion speeds up, slows down, or changes in some other way, allowing researchers to detect even small ground alterations.
As part of the RiftVolc consortium, COMET researchers David Pyle, Tamsin Mather and Juliet Biggs have co-authored a new paper on geothermal monitoring and volcanic hazard at Aluto volcano in the Ethiopian Rift Valley.
COMET researchers at the University of Oxford have estimated the total carbon emissions emanating from the Eastern Rift – the eastern branch of the East African Rift, a zone near the horn of East Africa where the crust stretches and splits.
A hot spring bubbling with carbon dioxide in Ethiopia near the Main Ethiopian Rift. Credit: Jonathan Hunt
The new study published in Geochemistry, Geophysics, Geosystems, led by COMET PhD student Jonathan Hunt, working alongside Tamsin Mather and David Pyle as well as colleagues from Oxford and Addis Ababa University, Ethiopia, extrapolates from soil carbon dioxide surveys to estimate that the Eastern Rift emits somewhere between 3.9 and 32.7 million metric tons (Mt) of carbon dioxide each year.
The research demonstrates how, even near some seemingly inactive volcanoes, carbon dioxide from melted rock seeps out through cracks in the surrounding crust.
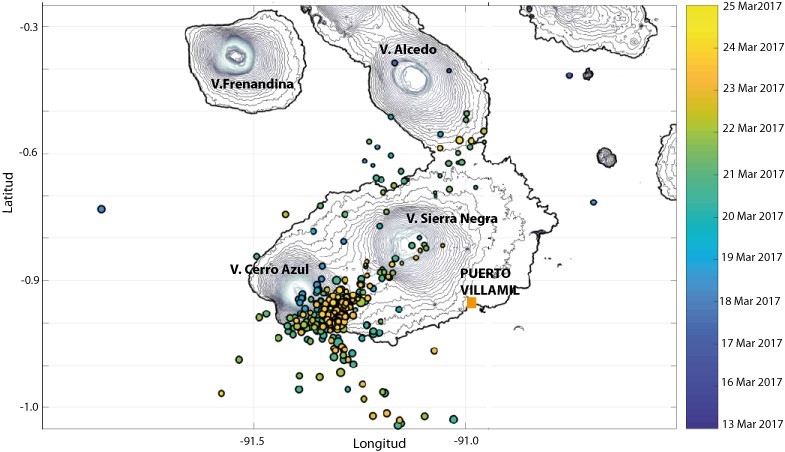
Cerro Azul is the southernmost active volcano on Isabela Island, Galápagos (Ecuador). On 18-19 March 2017, seismic activity increased on the SE flank of the volcano.
On the same day, the Instituto Geofisico Escuela Politécnica National (IGEPN), the organisation responsible for the monitoring of Ecuadorian volcanoes, issued a warning for a possible imminent eruption.
The recorded seismicity was composed of volcano tectonic (VT) earthquakes, consistent with processes of rock fracturing, with the majority of the events having magnitude ranging between 2.4 and 3. There were also sporadic events with magnitude up to 3.6 (see the second activity update released by IGEPN on 24 March).
The Sentinel-1 satellite acquired synthetic aperture radar data on 7 and 8 of March, prior to the onset of the seismic activity, and on 19 and 20 March, once seismicity started to exceed background levels both in terms of number of earthquakes and of energy release.
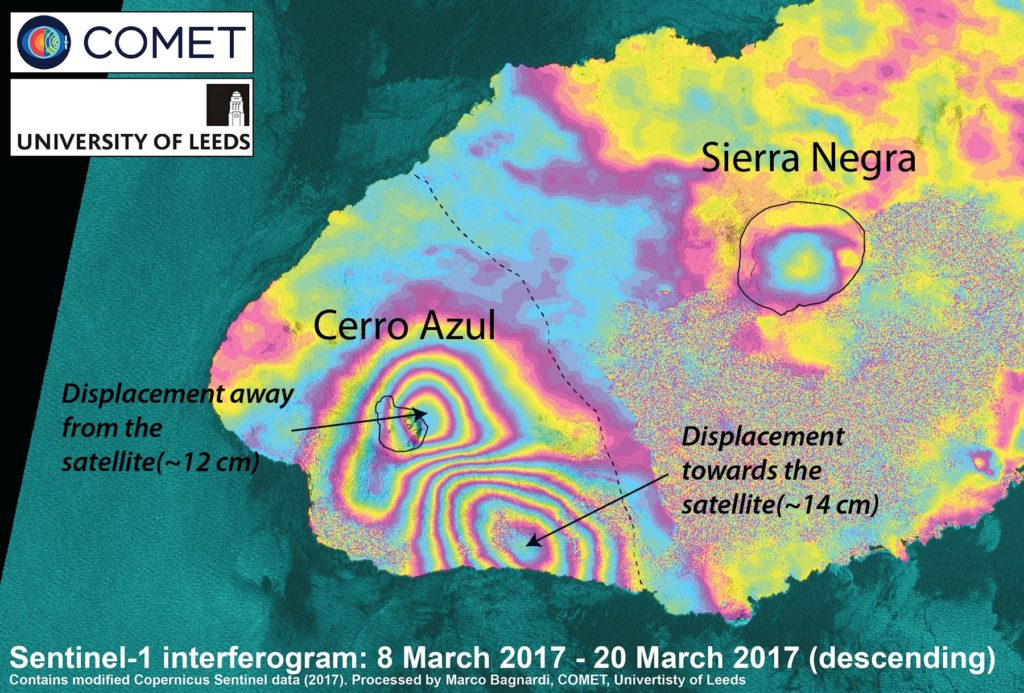
Applying SAR interferometric techniques (e.g. InSAR) showed significant deformation (up to 14 cm) in the region affected by the seismic swarm. More specifically, the InSAR data shows uplift at the southeastern flank of the volcano and contemporary subsidence centered at the summit of the volcano.
Sentinel-1 interferogram showing deformation caused by the magmatic intrusion as of 20 March 2017. Each color fringe corresponds to ~2.8 cm of displacement in the direction between the ground and the satellite.
COMET researcher Marco Bagnardi, working with the IGEPN, carried out a preliminary analysis of the InSAR data and observed that the deformation (at least as of 20 March 2017) can be explained by the intrusion of a 20-40 million cubic meters sill at a depth of ~5 km beneath the surface of the volcano.
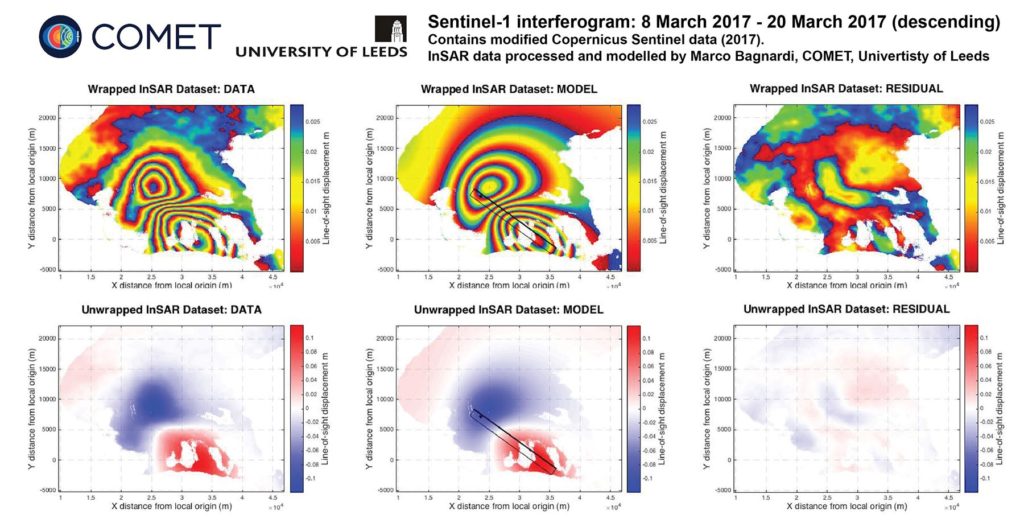
Modelling results from the inversion of InSAR data. The proposed model is composed of a horizontal sill intrusion at ~5 km depth (black rectangle) fed by a deflating source at ~6 km depth (black star).
Such intrusion is likely to be fed by a 6 km deep reservoir, cantered beneath the summit of the volcano. The location of the intrusion well matches the location of the seismicity recorded by IGEPN.
Marco Bagnardi said: “Within ten hours from receiving the warning from IGEPN, we were able to get hold of the most recent Sentinel-1 data for the area, process them to form differential interferograms, invert the data to infer the source of the observed deformation, and pass on the information to our Ecuadorian colleagues.”
The seismic activity seems to be continuing today. IGEPN is currently proposing two possible scenarios for the evolution of this episode of volcanic unrest:
the intrusion could reach the surface and feed an effusive eruption in the coming days or weeks, as happened in 1998 and 2008; or
seismic activity and deformation could return to background level without the eruption of magma at the surface.
The next Sentinel-1 acquisitions will be on 1 and 2 April. They will hopefully shed more light on the nature of the magmatic intrusion and on its evolution since 20 March.
Congratulations to COMET scientist Professor Andy Hooper, who has been awarded the American Geophysical Union (AGU) James B. Macelwane Medal in recognition of his contributions to the geophysical sciences.
Established in 1961, the medal is given to outstanding early career scientists who have shown depth, breadth, impact, creativity and novelty in their research.
Professor Hooper, who is also Co-Director of the Institute of Geophysics and Tectonics at University of Leeds, pioneered the development of new software (StaMPS) to extract ground displacements from time series of synthetic aperture radar (SAR) acquisitions. StaMPS is now used widely across the Earth Observation community.
He also discovered a new link between ice cap retreat and volcanism via geodetic monitoring from space and subsequent modelling of the 2010 Icelandic volcanic eruptions, and played a significant role in the €6m FUTUREVOLC project, leading the long-term deformation effort to integrate space and ground based observations for improved monitoring and evaluation of volcanic hazards.
Alongside other COMET researchers, he was part of a team contributing to the international scientific response to the earthquake which devastated Nepal in April 2015.
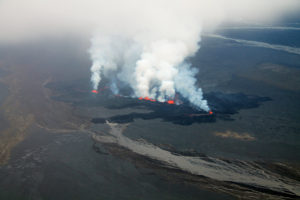
Eruption column and lava flow at Bárdarbunga, 22 September 2014. Credit: Thórdís Högnadóttir
Professor Hooper will be presented with the award at the 2016 AGU Fall Meeting, where he will also be giving a talk at the Union Session focusing on the new generation of scientists, where he will also be conferred an AGU fellow.
Congratulations Andy from all your colleagues at COMET.
COMET scientists have helped to shed new light on how volcanoes collapse during major eruptions, in new research published in Science.
The study, led by the University of Iceland, investigated a recent collapse at Bárdarbunga Volcano, Iceland, during the biggest volcanic eruption in Europe since the huge event at Laki in 1784.
Eruption column and lava flow from the air on 22 September 2014. Credit: Thórdís Högnadóttir
The largest eruptions on Earth are commonly associated with collapse of the roof of a volcano into a magma chamber below. As they are infrequent, however – only five caldera collapses were recorded during the twentieth century – the processes involved are poorly understood.
The Bárdarbunga eruption, which lasted from August 2014 until February 2015, produced 1.5 km3 of basaltic lava. In the course of the eruption, the top of the volcano caldera gradually sagged downwards, leaving an elongated bowl shaped depression over 13 km long and up to 65 m deep.
Bárdarbunga from the north, showing the main subsidence bowl within the caldera. Credit: Magnús T. Gudmundsson
The total volume of the subsidence was 1.8 km3 – similar to the total volume of lava erupted and injected into the crust , implying a strong link between the two.
COMET scientist Marco Bagnardi said: “We saw the events at Bárdarbunga as an opportunity to better understand caldera collapse, and used multiple techniques to investigate.”
COMET researchers used radar data from satellites to measure ground deformation at Bárdarbunga’s caldera over a number of 24 hour periods. As the topography continually changed, these data revealed movement of faults that reached to within a kilometre or so of the surface.
Combined with other techniques, including airborne altimetry, high precision GPS, seismology, radio-echo soundings, and ice flow modelling, the results were used to create a detailed picture and timeline of how the caldera was collapsing and why.
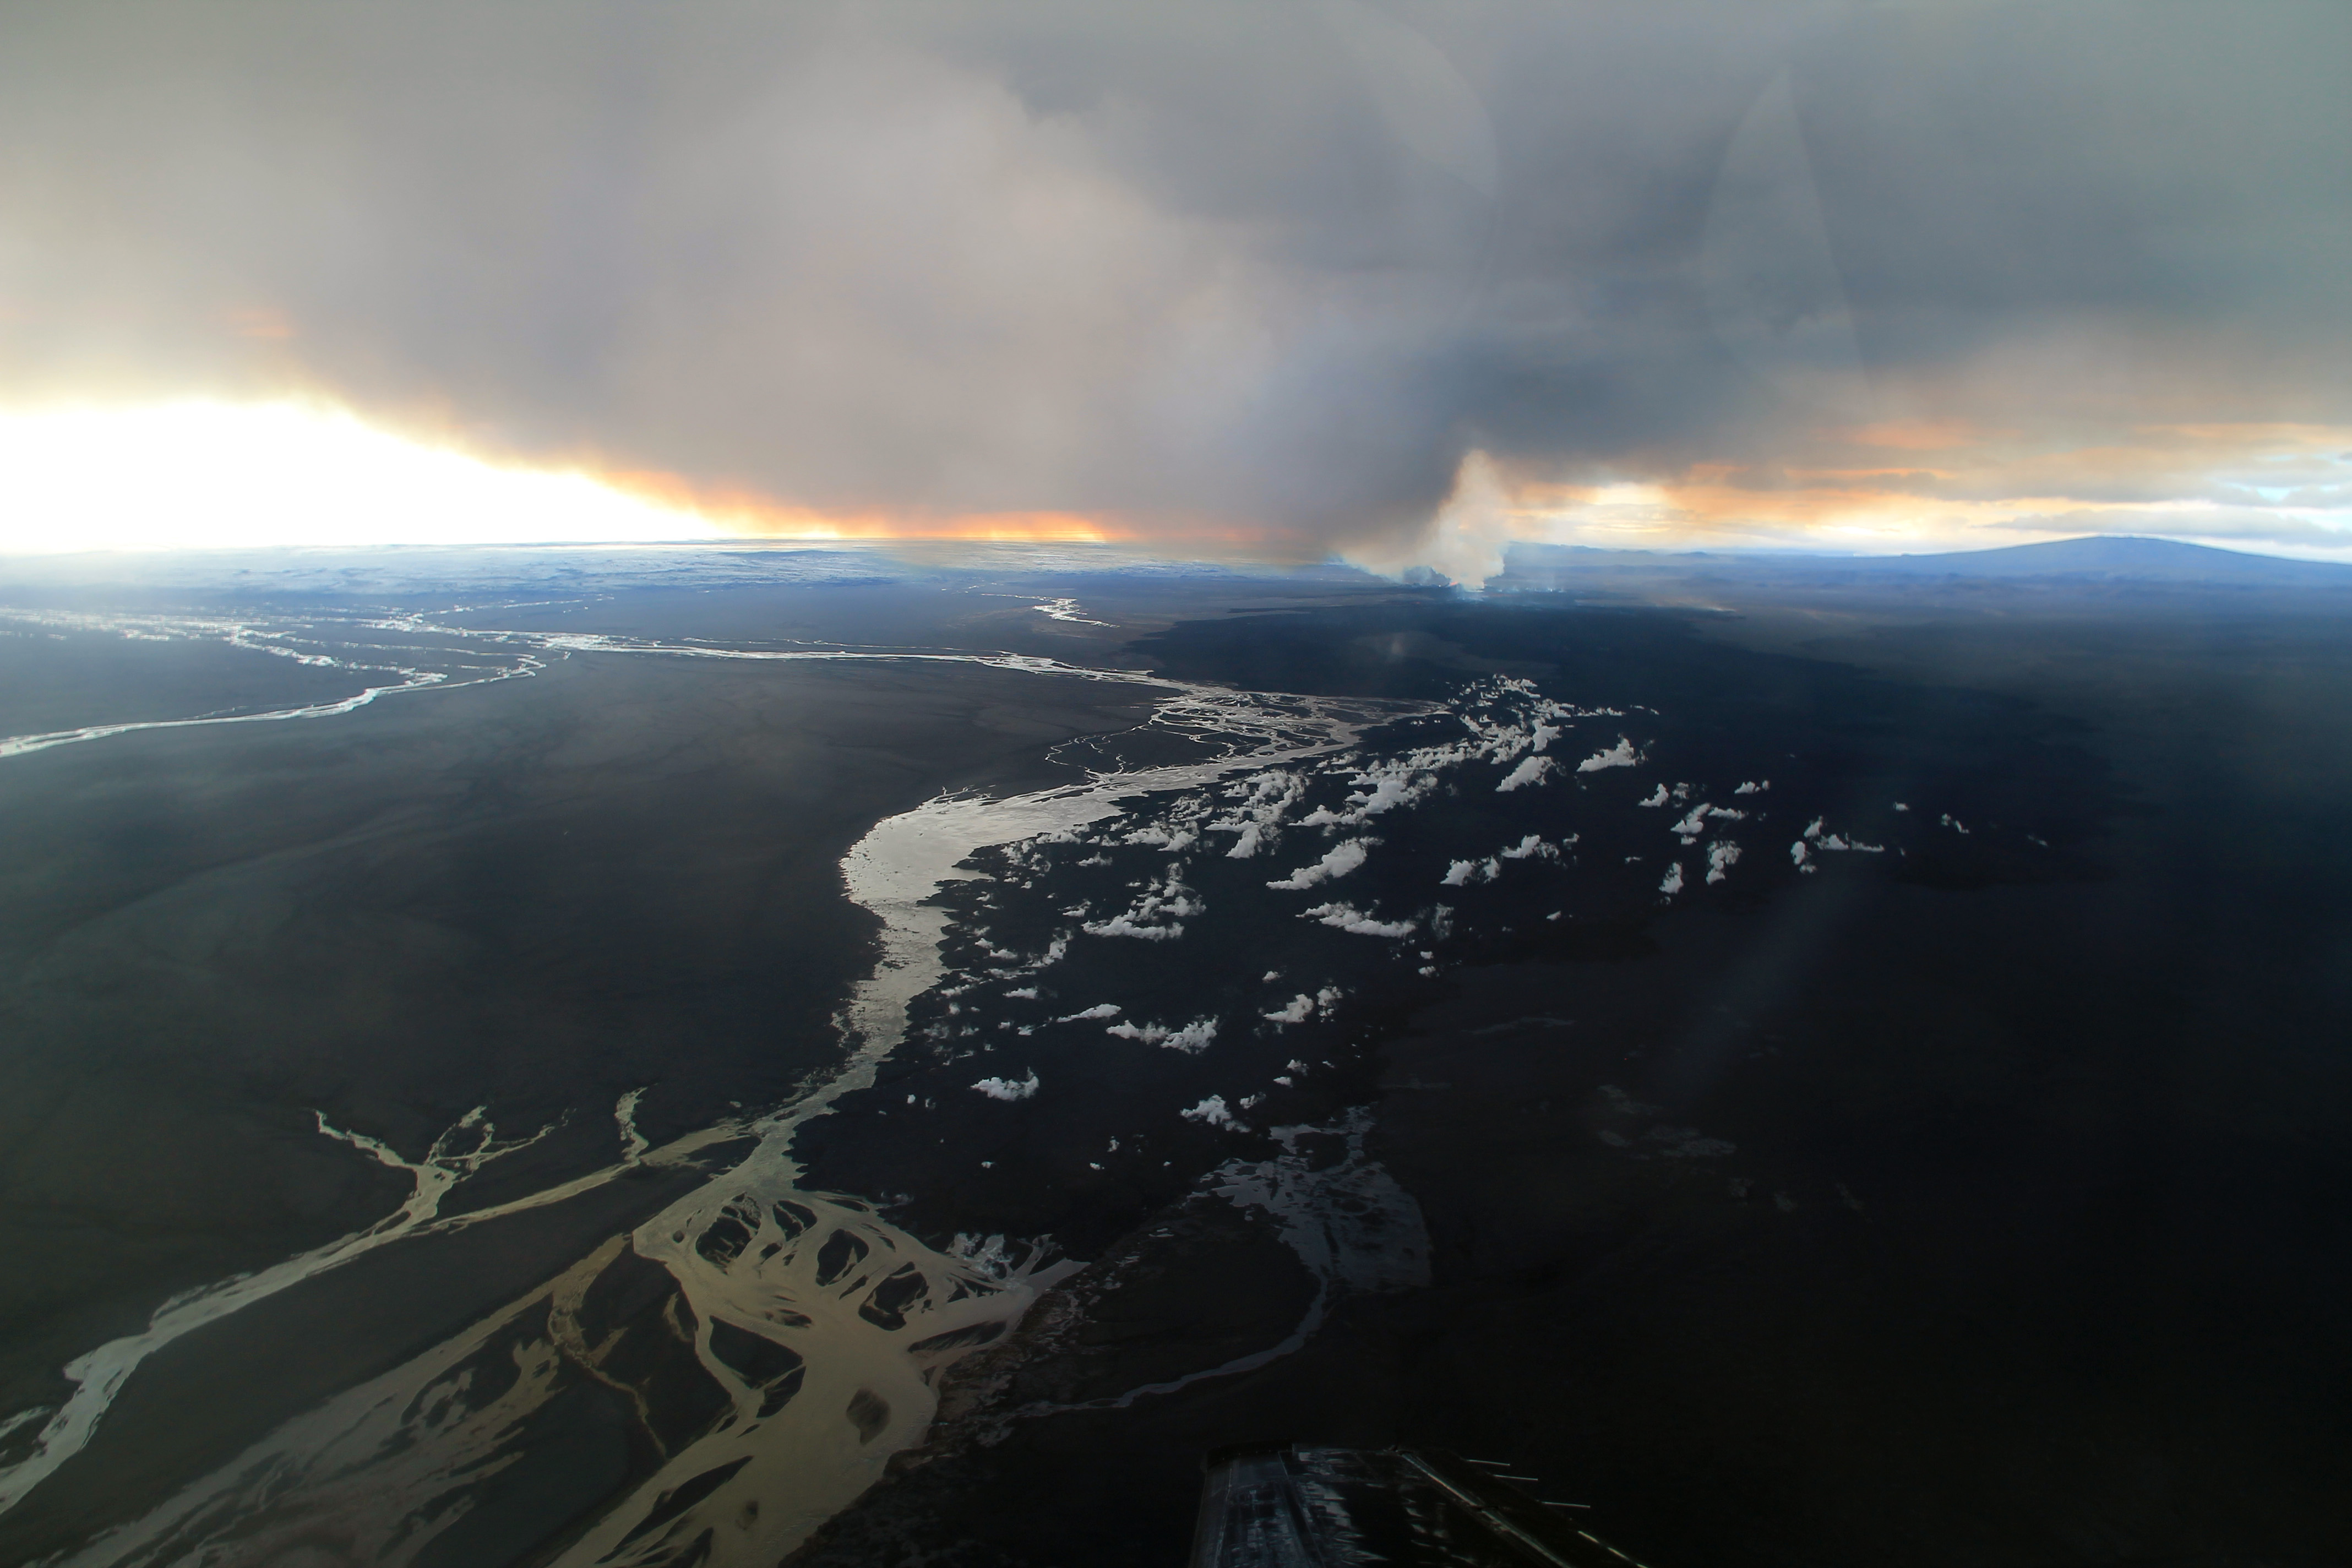
From 16 August 2014 – before the eruption began – magma had been migrating out of a chamber 12 km below the ground, forming a fracture in the Earth’s crust. Continued monitoring during the event showed that the magma was moving sideways from the volcano, beneath the surface, before finally erupting at Holuhraun, 47 km to the northeast, two weeks later.
The eruption in Holuhraun on its fourth day (3 September 2014). Credit: Thórdís Högnadóttir
Further analysis showed that a few days after the initial migration, the outflow of magma activated faults around the edge of the caldera leading to a series of earthquakes, which marked the beginning of the caldera collapse. The collapsing roof then acted like a piston forcing even more magma out of the chamber below, which in turn led to further collapse.
COMET scientist Professor Andy Hooper explained: “Through modelling many different data sets, we were able to show that the caldera collapse was caused by magma leaving the reservoir, and this in turn squeezed more magma out of the reservoir, forming a positive feedback. This mechanism led to much more magma being erupted than would otherwise have been the case, which explains how eruptions on an even larger scale can occur.”
Overall, between 12 and 20% of the magma had left the magma chamber when the caldera collapse began.
Summarising the research, Prof Hooper added: “This work has given us real insight into caldera collapse, not only at Bárdarbunga but also at even larger eruptions. What’s particularly interesting is how the collapse of the magma reservoir and the flow out of it clearly amplify each other.”
The paper, available now in Science, is Gudmundsson et al. (2016) Gradual caldera collapse at Bárdarbunga volcano, Iceland, regulated by lateral magma outflow, doi:10.1126/science.aaf8988.
A new paper published in Geophysical Research Letters by Tom Pering and Andrew McGonigle has combined fluid dynamical modelling of gas flow in conduits with high time resolution measurements of volcanic gas discharge for the first time, revealing new insights into the dynamics of Stromboli volcano.
Their work is based on a recently developed approach using ultraviolet cameras which enable measurements of volcanic gas emission rates with unprecedented time resolution – around 1 Hz – such that gas release patterns associated with rapid explosive and non-explosive basaltic processes, can be resolved for the first time.
Data were captured on Stromboli, where an intriguing coda of lifetime on the order of 10s of seconds was identified following each explosion. Computational models were also developed to simulate the upward flow of conduit filling, so called “Taylor bubbles”, which are believed to be responsible for explosions on Stromboli when they burst at the surface.
The numerical models reveal the fissioning of smaller bubbles from the Taylor bubble bases to generate a train of “daughter bubbles”, thought to be responsible for generating the post-explosive coda upon arrival at the surface.
This process could play a primary yet hitherto unconsidered role in driving the dynamics of strombolian volcanism, both on Stromboli and other targets worldwide, with significant implications for the magnitude of resulting eruptions.
Combining models with field observations in this way shows considerable promise for improving our understanding of how gases drive volcanic activity.
Airborne volcanic ash is a known hazard to aviation, but there are no current means to detect ash in-flight as the particles are too fine for on-board radar detection and, even in good visibility, ash clouds are difficult or impossible to detect by eye.
The economic cost and societal impact of the Icelandic eruption of Eyjafjallajökull generated renewed interest in finding ways to identify airborne volcanic ash in order to keep airspace open and avoid aircraft groundings.
The research, led by COMET Board Member Fred Prata, involved designing and building a bi-spectral, fast-sampling, uncooled infrared camera device (AVOID) to examine its ability to detect volcanic ash more than 50 km ahead of aircraft.
Experiments conducted over the Atlantic Ocean, off the coast of France involved an artificial ash cloud being created from a second aircraft, using ash from the Eyjafjallajökull eruption itself.
The measurements made by AVOID, along with additional in situ sampling, confirmed the ability of the device to detect and quantify ash in an artificial ash cloud. This is the first example of airborne remote detection of volcanic ash from a long-range flight test aircraft.
In the geological past, large eruptions have often occurred simultaneously at nearby volcanoes. Now, a team of COMET scientists from the University of Bristol uses satellite imagery to investigate the distances over which restless magmatic plumbing systems interact.
In a study published in the journal Nature Geoscience, the scientists use deformation maps from the Kenyan Rift to monitor pressure changes in a sequence of small magma lenses beneath a single volcano. Importantly, they find that active magma systems were not disturbed beneath neighboring volcanoes less than 15 km away.
The lead author, Dr Juliet Biggs, explained: “Our satellite data shows that unrest in Kenya was restricted to an individual system. Inter-bedded ash layers at these same volcanoes, however, tell us that they have erupted synchronously in the geological past. This was our first hint to compare observations of lateral interactions based on recent geophysical measurements with those from petrological analyses of much older eruptions.
The team, which includes a recently graduated PhD student Elspeth Robertson and Bristol’s Head of Volcanology Prof. Kathy Cashman, took this opportunity to compare observations from around the world with simple scaling laws based on potential interaction mechanisms. They found that stress changes from very large eruptions could influence volcanoes over distances of up to 50 km, but that smaller pressure changes associated with unrest require a different mechanism to explain the interactions.
Prof Cashman explained ‘Volcanology is undergoing a scientific revolution right now – the concept of a large vat of liquid magma beneath a volcano is being replaced by that of a crystalline mush that contains a network of melt or gas lenses. The interactions patterns observed in Kenya support this view, and help to constrain the geometry and location of individual melt and gas lenses.”
The study was funded by two major NERC projects: COMET, a world-leading research centre focusing on tectonic and volcanic processes using Earth observation techniques; and RiftVolc, which is studying the past, present and future behavior of volcanoes in the East African Rift.
Pablo Gonzalez’s work on the 2014 Pico do Fogo eruption has been featured in the AGU’s Eos magazine.
Pico do Fogo. Credit: Nicole Richter
The research uses a new satellite imaging system to model the subsurface path of the magma that fed the eruption, and shows that Sentinel-1’s TOPS InSAR technique has the potential to be used to study other natural hazards, including earthquakes and landslides.